29
/
en
AIzaSyAYiBZKx7MnpbEhh9jyipgxe19OcubqV5w
April 1, 2024
224950
Poland
POL
true
2
1
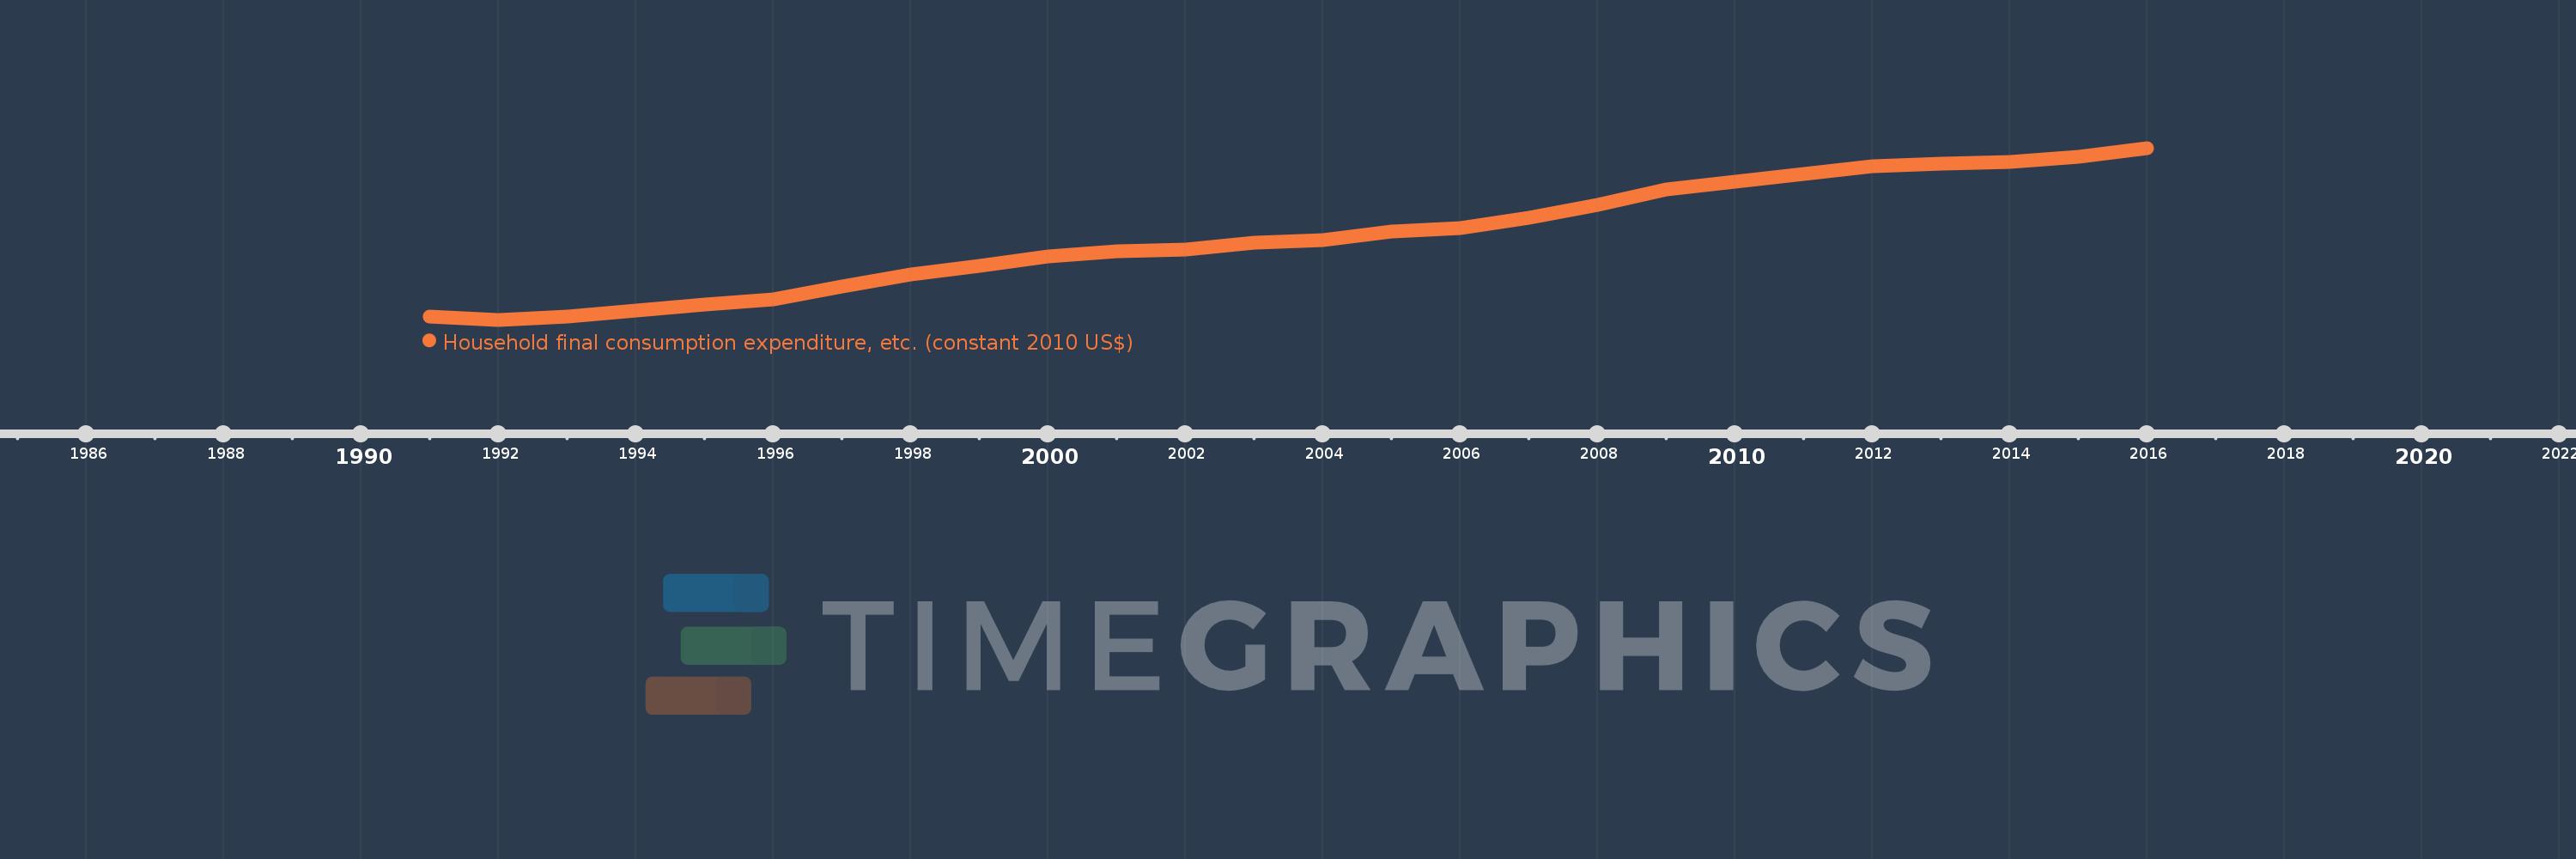
Household final consumption expenditure, etc. (constant 2010 US$)
2016,2015,2014,2013,2012,2011,2010,2009,2008,2007,2006,2005,2004,2003,2002,2001,2000,1999,1998,1997,1996,1995,1994,1993,1992,1991
This statistics in other country:
AfghanistanAlbaniaAlgeriaAngolaAntigua and BarbudaArab WorldArgentinaArmeniaArubaAustraliaAustriaAzerbaijanBahamas, TheBahrainBangladeshBarbadosBelarusBelgiumBelizeBeninBermudaBhutanBoliviaBosnia and HerzegovinaBotswanaBrazilBrunei DarussalamBulgariaBurkina FasoBurundiCabo VerdeCambodiaCameroonCanadaCaribbean small statesCentral African RepublicCentral Europe and the BalticsChadChileChinaColombiaComorosCongo, Dem. Rep.Congo, Rep.Cote d'IvoireCroatiaCubaCyprusCzech RepublicDenmarkDominicaDominican RepublicEarly-demographic dividendEast Asia & PacificEast Asia & Pacific (excluding high income)East Asia & Pacific (IDA & IBRD countries)EcuadorEgypt, Arab Rep.El SalvadorEquatorial GuineaEritreaEstoniaEuro areaEurope & Central AsiaEurope & Central Asia (excluding high income)Europe & Central Asia (IDA & IBRD countries)European UnionFaroe IslandsFinlandFragile and conflict affected situationsFranceGabonGambia, TheGeorgiaGermanyGhanaGreeceGrenadaGuatemalaGuineaGuinea-BissauGuyanaHaitiHeavily indebted poor countries (HIPC)High incomeHondurasHong Kong SAR, ChinaHungaryIBRD onlyIcelandIDA & IBRD totalIDA blendIDA onlyIDA totalIndiaIndonesiaIran, Islamic Rep.IraqIrelandIsraelItalyJamaicaJapanJordanKazakhstanKenyaKorea, Rep.KosovoKuwaitKyrgyz RepublicLao PDRLate-demographic dividendLatin America & Caribbean Latin America & Caribbean (excluding high income)Latin America & the Caribbean (IDA & IBRD countries)LatviaLeast developed countries: UN classificationLebanonLiberiaLithuaniaLow & middle incomeLow incomeLower middle incomeLuxembourgMacao SAR, ChinaMacedonia, FYRMadagascarMalawiMalaysiaMaliMaltaMauritaniaMauritiusMexicoMiddle East & North AfricaMiddle East & North Africa (excluding high income)Middle East & North Africa (IDA & IBRD countries)Middle incomeMoldovaMongoliaMontenegroMoroccoMozambiqueNamibiaNepalNetherlandsNew ZealandNicaraguaNigerNigeriaNorth AmericaNorwayOECD membersOmanOther small statesPakistanPanamaParaguayPeruPhilippinesPolandPortugalPost-demographic dividendPre-demographic dividendPuerto RicoQatarRomaniaRussian FederationRwandaSaudi ArabiaSenegalSerbiaSeychellesSierra LeoneSingaporeSlovak RepublicSloveniaSmall statesSouth AfricaSouth AsiaSouth Asia (IDA & IBRD)South SudanSpainSri LankaSt. Kitts and NevisSt. LuciaSt. Vincent and the GrenadinesSub-Saharan Africa Sub-Saharan Africa (excluding high income)Sub-Saharan Africa (IDA & IBRD countries)SudanSurinameSwazilandSwedenSwitzerlandTajikistanTanzaniaThailandTimor-LesteTogoTongaTrinidad and TobagoTunisiaTurkeyTurkmenistanUgandaUkraineUnited Arab EmiratesUnited KingdomUnited StatesUpper middle incomeUruguayUzbekistanVanuatuVenezuela, RBVietnamWest Bank and GazaWorldYemen, Rep.ZambiaZimbabwe Timeline:
This timeline shows a graph from 1991 to 2016 of Poland. No data until 1990. Number of actual observations by date: 26.
Source name:
World Development Indicators
Source organization:
World Bank national accounts data, and OECD National Accounts data files.
Categories, topics:
Economy & Growth
Last updated:
apr 23, 2017
Indicators value changes by year
Minimum:
130.345 bln
jan 1, 1992
Maximum:
325.037 bln
jan 1, 2016
At the date of observation
Value
Absolute change
Change from previous value
jan 1, 1991
134.395 bln
+134.395 bln
0.0%
jan 1, 1992
130.345 bln
-4.05 bln
-3.01%
jan 1, 1993
133.951 bln
+3.605 bln
2.77%
jan 1, 1994
140.425 bln
+6.475 bln
4.83%
jan 1, 1995
147.967 bln
+7.542 bln
5.37%
jan 1, 1996
153.655 bln
+5.688 bln
3.84%
jan 1, 1997
167.796 bln
+14.141 bln
9.2%
jan 1, 1998
181.501 bln
+13.705 bln
8.17%
jan 1, 1999
191.324 bln
+9.823 bln
5.41%
jan 1, 2000
201.978 bln
+10.654 bln
5.57%
jan 1, 2001
207.572 bln
+5.594 bln
2.77%
jan 1, 2002
210.048 bln
+2.477 bln
1.19%
jan 1, 2003
217.611 bln
+7.563 bln
3.6%
jan 1, 2004
220.5 bln
+2.889 bln
1.33%
jan 1, 2005
230.228 bln
+9.729 bln
4.41%
jan 1, 2006
234.281 bln
+4.053 bln
1.76%
jan 1, 2007
245.692 bln
+11.41 bln
4.87%
jan 1, 2008
260.331 bln
+14.639 bln
5.96%
jan 1, 2009
277.868 bln
+17.537 bln
6.74%
jan 1, 2010
286.84 bln
+8.973 bln
3.23%
jan 1, 2011
295.095 bln
+8.255 bln
2.88%
jan 1, 2012
304.387 bln
+9.292 bln
3.15%
jan 1, 2013
307.144 bln
+2.757 bln
0.91%
jan 1, 2014
308.78 bln
+1.636 bln
0.53%
jan 1, 2015
314.991 bln
+6.21 bln
2.01%
jan 1, 2016
325.037 bln
+10.047 bln
3.19%
Ranking of countries by current statistics by years


Comments: