29
/
en
AIzaSyAYiBZKx7MnpbEhh9jyipgxe19OcubqV5w
April 1, 2024
249201
Sri Lanka
LKA
true
2
1
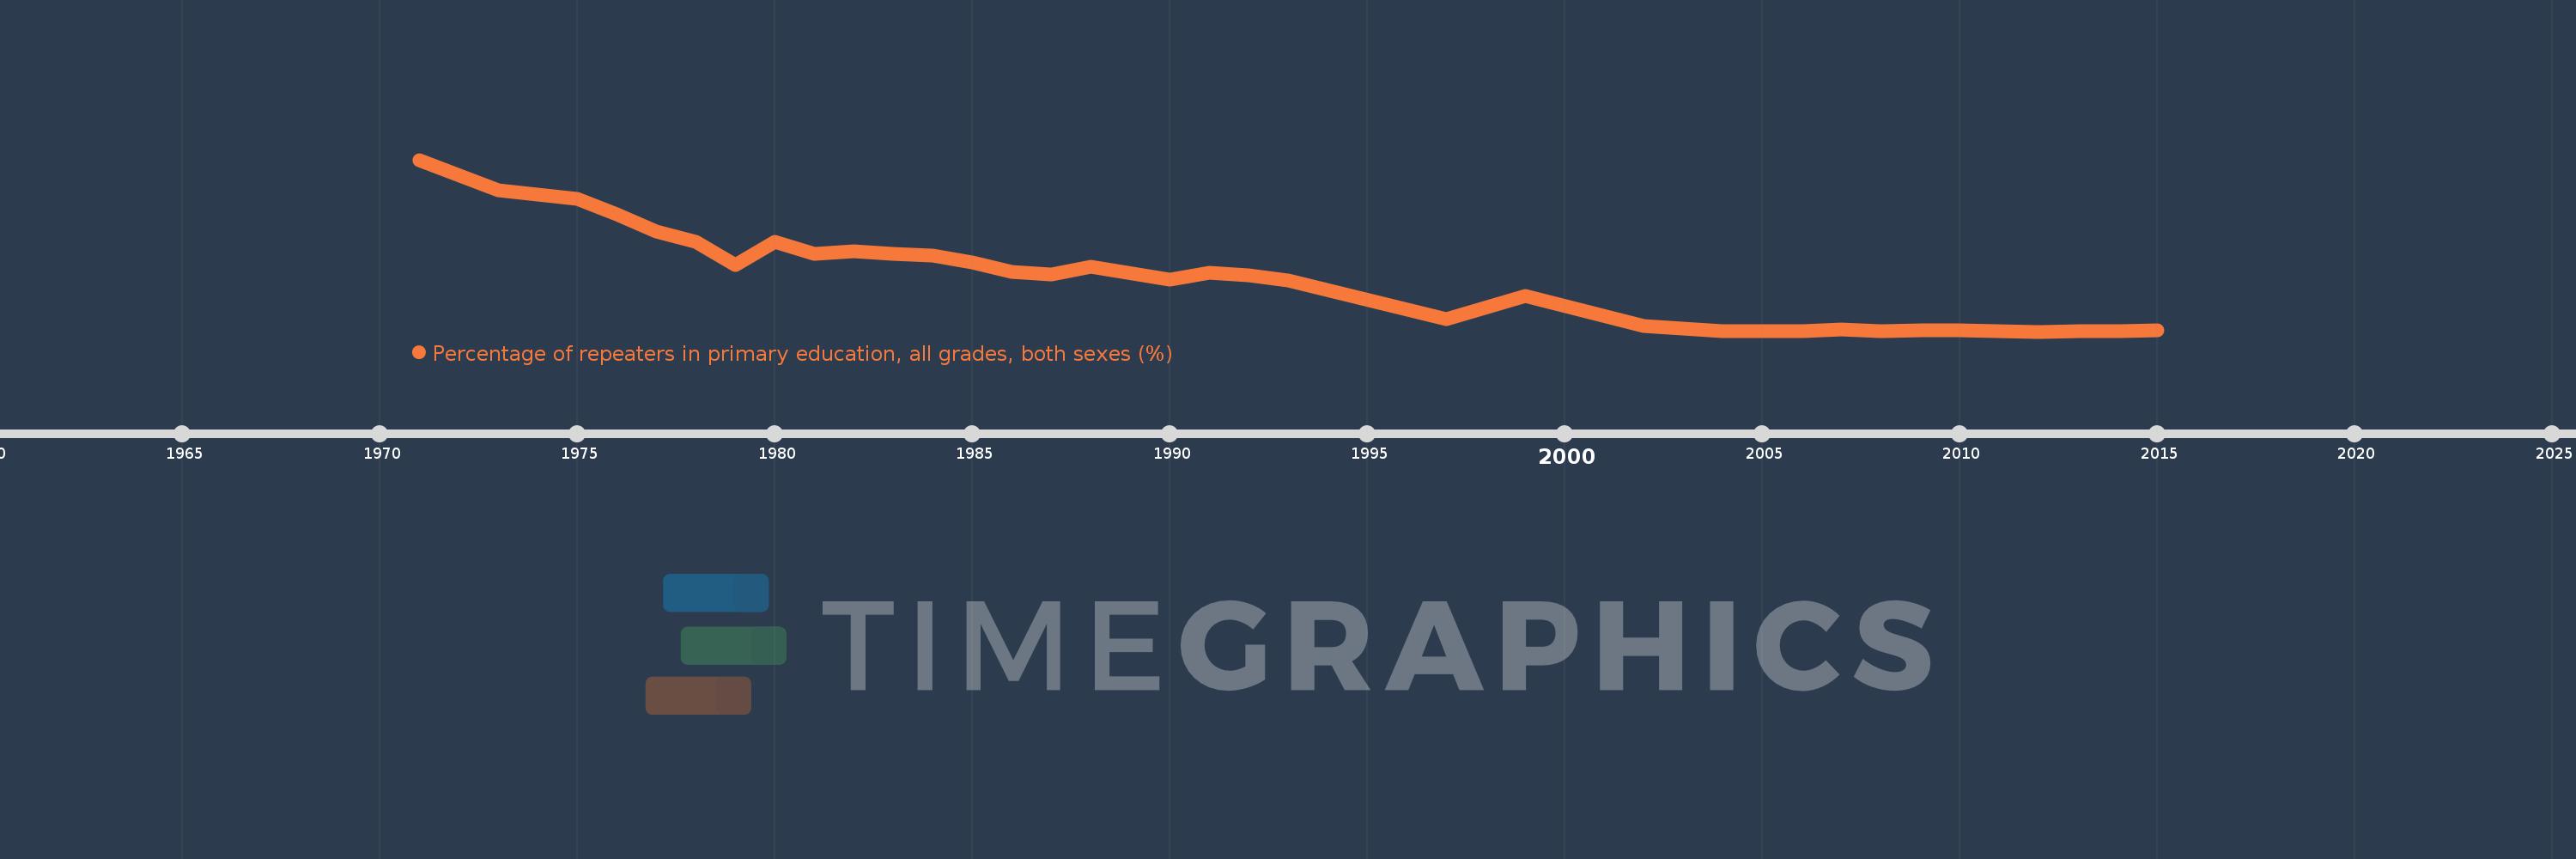
Percentage of repeaters in primary education, all grades, both sexes (%)
2015,2014,2013,2012,2011,2010,2009,2008,2007,2006,2004,2002,1999,1997,1993,1992,1991,1990,1988,1987,1986,1985,1984,1983,1982,1981,1980,1979,1978,1977,1976,1975,1973,1971
This statistics in other country:
AfghanistanAlbaniaAlgeriaAndorraAngolaAntigua and BarbudaArab WorldArgentinaArmeniaArubaAustriaAzerbaijanBahamas, TheBahrainBangladeshBelarusBelgiumBelizeBeninBermudaBhutanBoliviaBosnia and HerzegovinaBotswanaBrazilBritish Virgin IslandsBrunei DarussalamBulgariaBurkina FasoBurundiCabo VerdeCambodiaCameroonCanadaCaribbean small statesCayman IslandsCentral African RepublicCentral Europe and the BalticsChadChileChinaColombiaComorosCongo, Dem. Rep.Congo, Rep.Costa RicaCote d'IvoireCroatiaCubaCyprusCzech RepublicDenmarkDjiboutiDominicaDominican RepublicEarly-demographic dividendEast Asia & PacificEast Asia & Pacific (excluding high income)East Asia & Pacific (IDA & IBRD countries)EcuadorEgypt, Arab Rep.El SalvadorEquatorial GuineaEritreaEstoniaEthiopiaEuro areaEurope & Central AsiaEurope & Central Asia (excluding high income)Europe & Central Asia (IDA & IBRD countries)European UnionFijiFinlandFragile and conflict affected situationsFranceGabonGambia, TheGeorgiaGermanyGhanaGreeceGrenadaGuatemalaGuineaGuinea-BissauGuyanaHaitiHeavily indebted poor countries (HIPC)High incomeHondurasHong Kong SAR, ChinaHungaryIBRD onlyIcelandIDA & IBRD totalIDA blendIDA onlyIDA totalIndiaIndonesiaIran, Islamic Rep.IraqIrelandIsraelItalyJamaicaJapanJordanKazakhstanKenyaKiribatiKorea, Rep.KuwaitKyrgyz RepublicLao PDRLate-demographic dividendLatin America & Caribbean Latin America & Caribbean (excluding high income)Latin America & the Caribbean (IDA & IBRD countries)LatviaLeast developed countries: UN classificationLebanonLesothoLiberiaLibyaLiechtensteinLithuaniaLow & middle incomeLow incomeLower middle incomeLuxembourgMacao SAR, ChinaMacedonia, FYRMadagascarMalawiMalaysiaMaldivesMaliMaltaMauritaniaMauritiusMexicoMiddle East & North AfricaMiddle East & North Africa (excluding high income)Middle East & North Africa (IDA & IBRD countries)Middle incomeMoldovaMonacoMongoliaMontenegroMoroccoMozambiqueMyanmarNamibiaNauruNepalNetherlandsNew ZealandNicaraguaNigerNorwayOECD membersOmanOther small statesPacific island small statesPakistanPalauPanamaPapua New GuineaParaguayPeruPhilippinesPolandPortugalPost-demographic dividendPre-demographic dividendQatarRomaniaRussian FederationRwandaSamoaSan MarinoSao Tome and PrincipeSaudi ArabiaSenegalSerbiaSeychellesSierra LeoneSingaporeSint Maarten (Dutch part)Slovak RepublicSloveniaSmall statesSolomon IslandsSomaliaSouth AfricaSouth AsiaSouth Asia (IDA & IBRD)South SudanSpainSri LankaSt. Kitts and NevisSt. LuciaSt. Vincent and the GrenadinesSub-Saharan Africa Sub-Saharan Africa (excluding high income)Sub-Saharan Africa (IDA & IBRD countries)SudanSurinameSwazilandSwedenSwitzerlandSyrian Arab RepublicTajikistanTanzaniaThailandTimor-LesteTogoTongaTrinidad and TobagoTunisiaTurkeyTurks and Caicos IslandsTuvaluUgandaUkraineUnited Arab EmiratesUnited KingdomUpper middle incomeUruguayUzbekistanVanuatuVenezuela, RBVietnamWest Bank and GazaWorldYemen, Rep.ZambiaZimbabwe Timeline:
This timeline shows a graph from 1971 to 2015 of Sri Lanka. No data until 1970. Number of actual observations by date: 34.
Source name:
World Development Indicators
Source organization:
UNESCO Institute for Statistics
Categories, topics:
Education
Last updated:
apr 23, 2017
Indicators value changes by year
Maximum:
22.205
jan 1, 1971
At the date of observation
Value
Absolute change
Change from previous value
jan 1, 1971
22.205
+22.205
0.0%
jan 1, 1973
18.428
-3.777
-17.01%
jan 1, 1975
17.299
-1.129
-6.13%
jan 1, 1976
15.41
-1.888
-10.92%
jan 1, 1977
13.225
-2.185
-14.18%
jan 1, 1978
11.944
-1.281
-9.69%
jan 1, 1979
9.075
-2.869
-24.02%
jan 1, 1980
11.946
+2.871
31.64%
jan 1, 1981
10.432
-1.515
-12.68%
jan 1, 1982
10.79
+0.358
3.43%
jan 1, 1983
10.431
-0.359
-3.32%
jan 1, 1984
10.224
-0.208
-1.99%
jan 1, 1985
9.35
-0.874
-8.54%
jan 1, 1986
8.21
-1.141
-12.2%
jan 1, 1987
7.891
-0.319
-3.88%
jan 1, 1988
8.858
+0.967
12.25%
jan 1, 1990
7.167
-1.691
-19.09%
jan 1, 1991
8.043
+0.876
12.22%
jan 1, 1992
7.711
-0.332
-4.13%
jan 1, 1993
7.056
-0.655
-8.49%
jan 1, 1997
2.301
-4.756
-67.4%
jan 1, 1999
5.133
+2.833
123.12%
jan 1, 2002
1.406
-3.727
-72.61%
jan 1, 2004
0.81
-0.596
-42.37%
jan 1, 2006
0.805
-0.006
-0.71%
jan 1, 2007
0.949
+0.145
18.0%
jan 1, 2008
0.808
-0.141
-14.87%
jan 1, 2009
0.824
+0.016
1.96%
jan 1, 2010
0.874
+0.05
6.09%
jan 1, 2011
0.732
-0.142
-16.27%
jan 1, 2012
0.707
-0.025
-3.36%
jan 1, 2013
0.802
+0.095
13.43%
jan 1, 2014
0.791
-0.011
-1.37%
jan 1, 2015
0.886
+0.095
12.01%
Ranking of countries by current statistics by years


Comments: