29
/
en
AIzaSyAYiBZKx7MnpbEhh9jyipgxe19OcubqV5w
April 1, 2024
44556
Least developed countries: UN classification
LDC
false
2
1
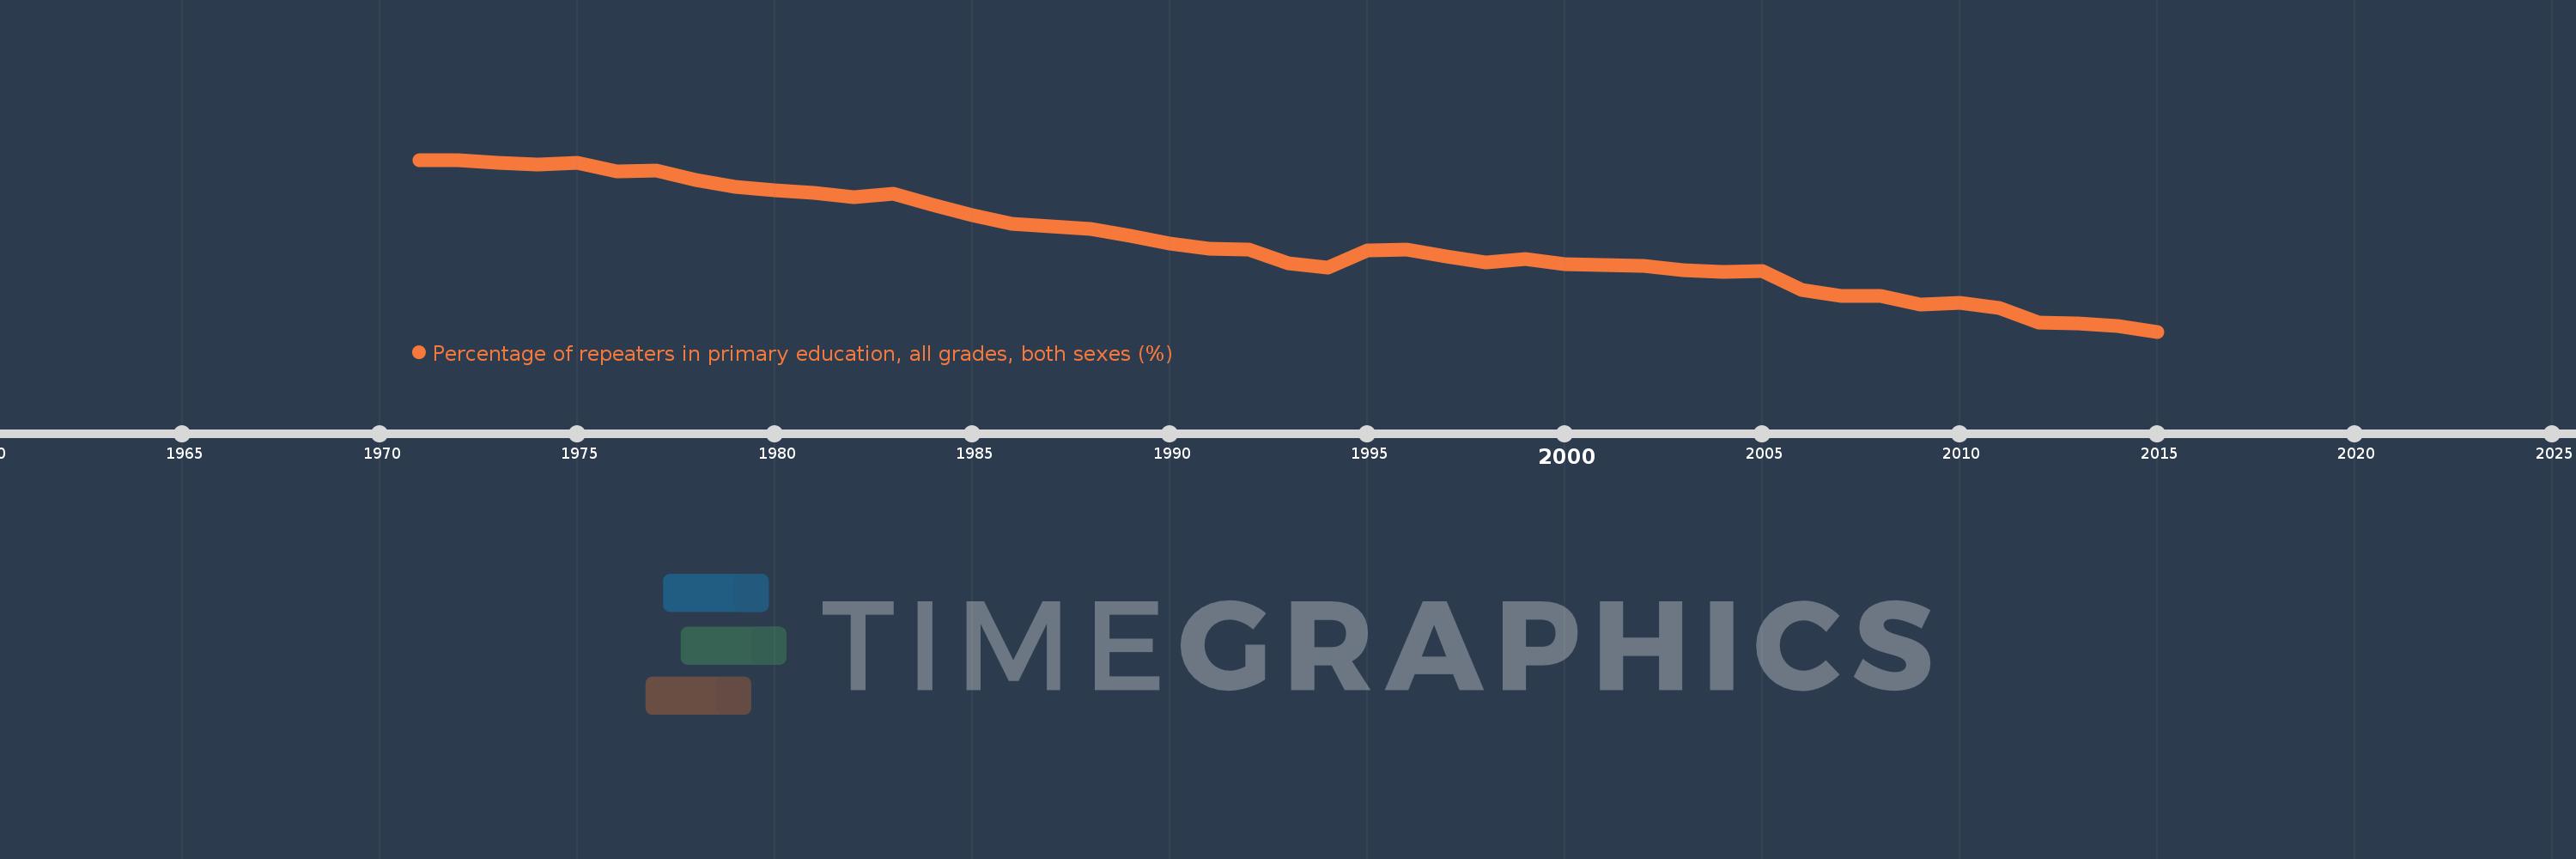
Percentage of repeaters in primary education, all grades, both sexes (%)
2015,2014,2013,2012,2011,2010,2009,2008,2007,2006,2005,2004,2003,2002,2001,2000,1999,1998,1997,1996,1995,1994,1993,1992,1991,1990,1989,1988,1987,1986,1985,1984,1983,1982,1981,1980,1979,1978,1977,1976,1975,1974,1973,1972,1971
This statistics in other country:
AfghanistanAlbaniaAlgeriaAndorraAngolaAntigua and BarbudaArab WorldArgentinaArmeniaArubaAustriaAzerbaijanBahamas, TheBahrainBangladeshBelarusBelgiumBelizeBeninBermudaBhutanBoliviaBosnia and HerzegovinaBotswanaBrazilBritish Virgin IslandsBrunei DarussalamBulgariaBurkina FasoBurundiCabo VerdeCambodiaCameroonCanadaCaribbean small statesCayman IslandsCentral African RepublicCentral Europe and the BalticsChadChileChinaColombiaComorosCongo, Dem. Rep.Congo, Rep.Costa RicaCote d'IvoireCroatiaCubaCyprusCzech RepublicDenmarkDjiboutiDominicaDominican RepublicEarly-demographic dividendEast Asia & PacificEast Asia & Pacific (excluding high income)East Asia & Pacific (IDA & IBRD countries)EcuadorEgypt, Arab Rep.El SalvadorEquatorial GuineaEritreaEstoniaEthiopiaEuro areaEurope & Central AsiaEurope & Central Asia (excluding high income)Europe & Central Asia (IDA & IBRD countries)European UnionFijiFinlandFragile and conflict affected situationsFranceGabonGambia, TheGeorgiaGermanyGhanaGreeceGrenadaGuatemalaGuineaGuinea-BissauGuyanaHaitiHeavily indebted poor countries (HIPC)High incomeHondurasHong Kong SAR, ChinaHungaryIBRD onlyIcelandIDA & IBRD totalIDA blendIDA onlyIDA totalIndiaIndonesiaIran, Islamic Rep.IraqIrelandIsraelItalyJamaicaJapanJordanKazakhstanKenyaKiribatiKorea, Rep.KuwaitKyrgyz RepublicLao PDRLate-demographic dividendLatin America & Caribbean Latin America & Caribbean (excluding high income)Latin America & the Caribbean (IDA & IBRD countries)LatviaLeast developed countries: UN classificationLebanonLesothoLiberiaLibyaLiechtensteinLithuaniaLow & middle incomeLow incomeLower middle incomeLuxembourgMacao SAR, ChinaMacedonia, FYRMadagascarMalawiMalaysiaMaldivesMaliMaltaMauritaniaMauritiusMexicoMiddle East & North AfricaMiddle East & North Africa (excluding high income)Middle East & North Africa (IDA & IBRD countries)Middle incomeMoldovaMonacoMongoliaMontenegroMoroccoMozambiqueMyanmarNamibiaNauruNepalNetherlandsNew ZealandNicaraguaNigerNorwayOECD membersOmanOther small statesPacific island small statesPakistanPalauPanamaPapua New GuineaParaguayPeruPhilippinesPolandPortugalPost-demographic dividendPre-demographic dividendQatarRomaniaRussian FederationRwandaSamoaSan MarinoSao Tome and PrincipeSaudi ArabiaSenegalSerbiaSeychellesSierra LeoneSingaporeSint Maarten (Dutch part)Slovak RepublicSloveniaSmall statesSolomon IslandsSomaliaSouth AfricaSouth AsiaSouth Asia (IDA & IBRD)South SudanSpainSri LankaSt. Kitts and NevisSt. LuciaSt. Vincent and the GrenadinesSub-Saharan Africa Sub-Saharan Africa (excluding high income)Sub-Saharan Africa (IDA & IBRD countries)SudanSurinameSwazilandSwedenSwitzerlandSyrian Arab RepublicTajikistanTanzaniaThailandTimor-LesteTogoTongaTrinidad and TobagoTunisiaTurkeyTurks and Caicos IslandsTuvaluUgandaUkraineUnited Arab EmiratesUnited KingdomUpper middle incomeUruguayUzbekistanVanuatuVenezuela, RBVietnamWest Bank and GazaWorldYemen, Rep.ZambiaZimbabwe Timeline:
This timeline shows a graph from 1971 to 2015 of Least developed countries: UN classification. No data until 1970. Number of actual observations by date: 45.
Source name:
World Development Indicators
Source organization:
UNESCO Institute for Statistics
Categories, topics:
Education
Last updated:
apr 23, 2017
Indicators value changes by year
At the date of observation
Value
Absolute change
Change from previous value
jan 1, 1971
17.51
+17.51
0.0%
jan 1, 1972
17.501
-0.008
-0.05%
jan 1, 1973
17.354
-0.147
-0.84%
jan 1, 1974
17.304
-0.051
-0.29%
jan 1, 1975
17.36
+0.057
0.33%
jan 1, 1976
16.995
-0.365
-2.11%
jan 1, 1977
17.002
+0.007
0.04%
jan 1, 1978
16.567
-0.434
-2.55%
jan 1, 1979
16.248
-0.32
-1.93%
jan 1, 1980
16.107
-0.141
-0.87%
jan 1, 1981
16.001
-0.106
-0.66%
jan 1, 1982
15.771
-0.23
-1.44%
jan 1, 1983
15.947
+0.176
1.12%
jan 1, 1984
15.421
-0.526
-3.3%
jan 1, 1985
14.97
-0.451
-2.92%
jan 1, 1986
14.577
-0.394
-2.63%
jan 1, 1987
14.441
-0.135
-0.93%
jan 1, 1988
14.322
-0.119
-0.83%
jan 1, 1989
13.991
-0.331
-2.31%
jan 1, 1990
13.646
-0.346
-2.47%
jan 1, 1991
13.429
-0.216
-1.59%
jan 1, 1992
13.39
-0.039
-0.29%
jan 1, 1993
12.735
-0.655
-4.89%
jan 1, 1994
12.527
-0.208
-1.63%
jan 1, 1995
13.35
+0.822
6.57%
jan 1, 1996
13.366
+0.016
0.12%
jan 1, 1997
13.039
-0.327
-2.44%
jan 1, 1998
12.784
-0.255
-1.96%
jan 1, 1999
12.948
+0.164
1.28%
jan 1, 2000
12.698
-0.25
-1.93%
jan 1, 2001
12.667
-0.031
-0.24%
jan 1, 2002
12.623
-0.044
-0.35%
jan 1, 2003
12.408
-0.215
-1.7%
jan 1, 2004
12.335
-0.073
-0.59%
jan 1, 2005
12.383
+0.048
0.39%
jan 1, 2006
11.509
-0.874
-7.06%
jan 1, 2007
11.226
-0.283
-2.46%
jan 1, 2008
11.226
0.0
0.0%
jan 1, 2009
10.834
-0.392
-3.49%
jan 1, 2010
10.918
+0.084
0.77%
jan 1, 2011
10.675
-0.243
-2.22%
jan 1, 2012
9.991
-0.684
-6.4%
jan 1, 2013
9.977
-0.014
-0.14%
jan 1, 2014
9.859
-0.117
-1.18%
jan 1, 2015
9.593
-0.267
-2.7%
Ranking of countries by current statistics by years


Comments: