29
/
en
AIzaSyAYiBZKx7MnpbEhh9jyipgxe19OcubqV5w
April 1, 2024
54340
Pacific island small states
PSS
false
2
1
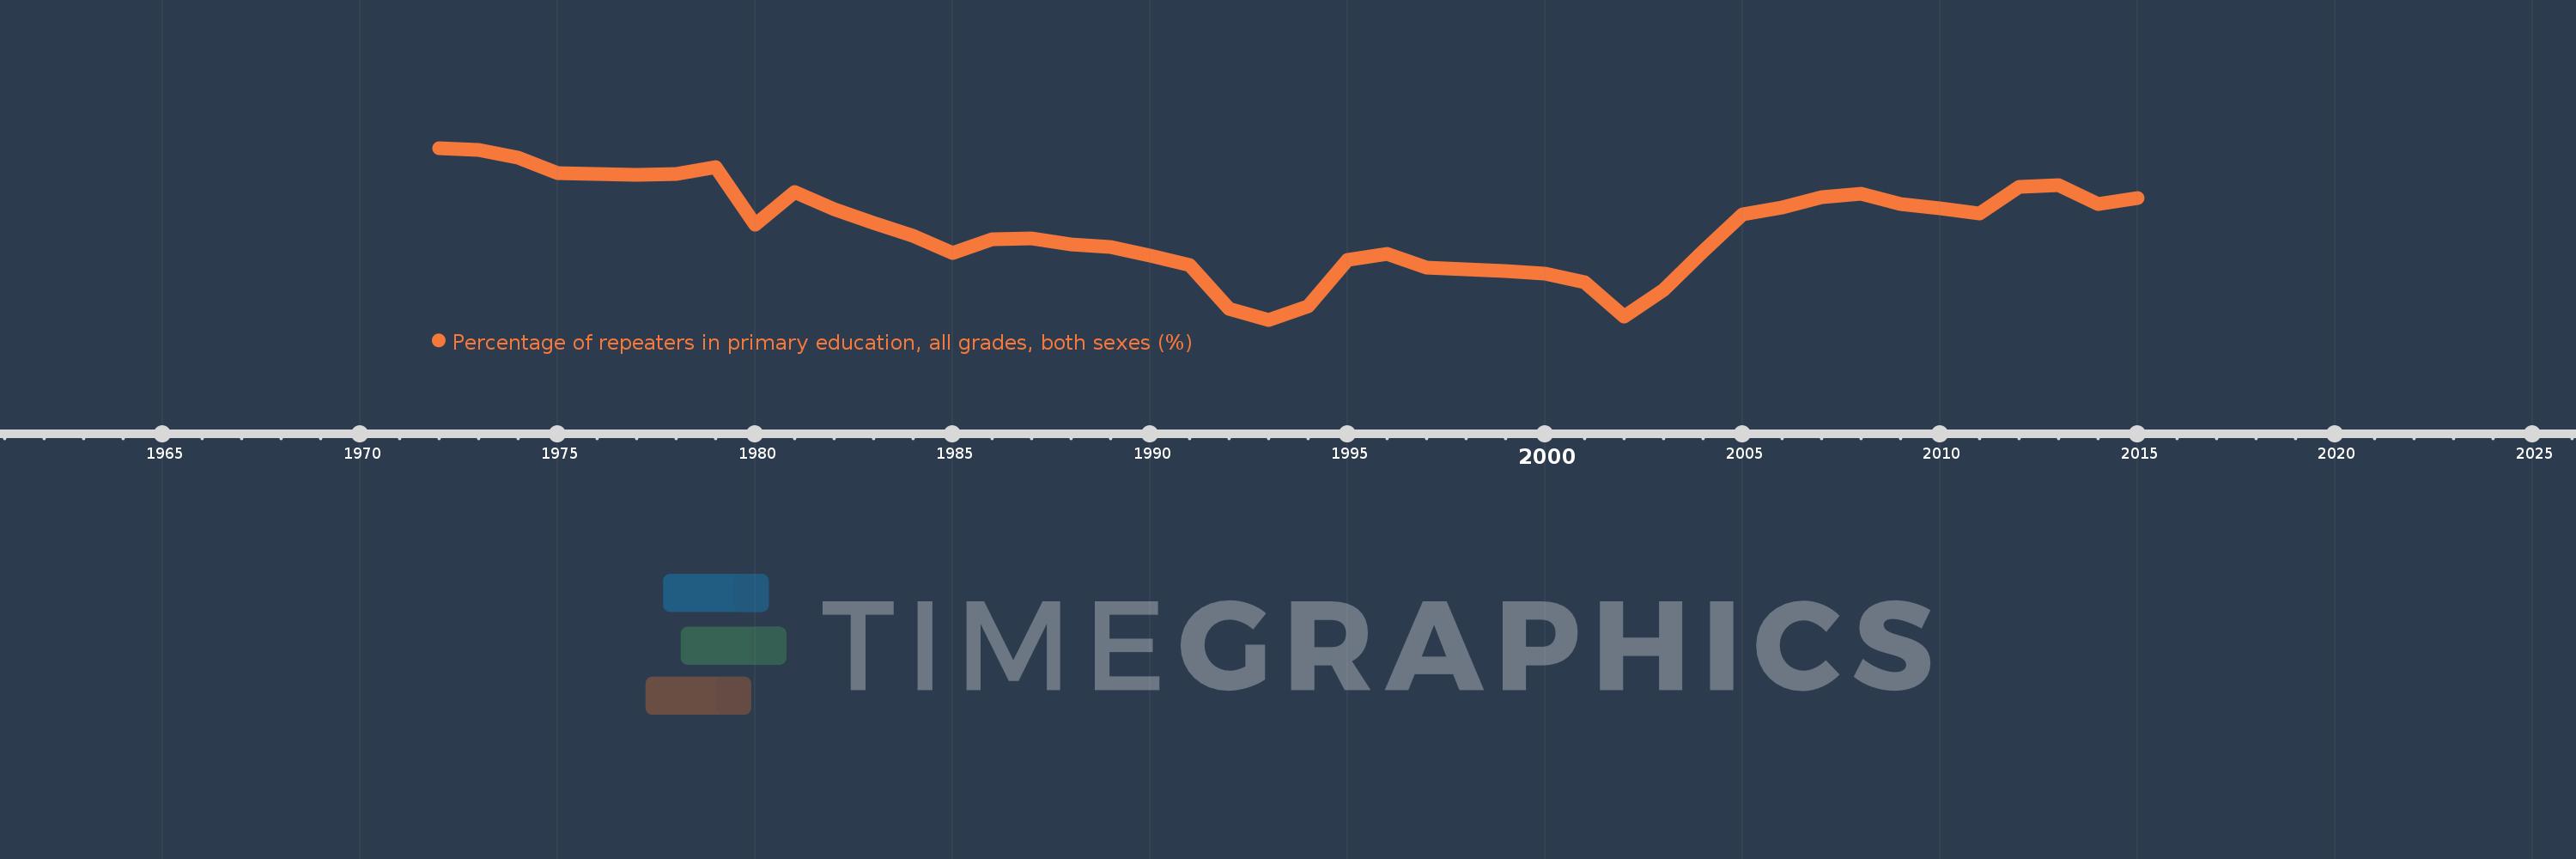
Percentage of repeaters in primary education, all grades, both sexes (%)
2015,2014,2013,2012,2011,2010,2009,2008,2007,2006,2005,2004,2003,2002,2001,2000,1999,1998,1997,1996,1995,1994,1993,1992,1991,1990,1989,1988,1987,1986,1985,1984,1983,1982,1981,1980,1979,1978,1977,1976,1975,1974,1973,1972
This statistics in other country:
AfghanistanAlbaniaAlgeriaAndorraAngolaAntigua and BarbudaArab WorldArgentinaArmeniaArubaAustriaAzerbaijanBahamas, TheBahrainBangladeshBelarusBelgiumBelizeBeninBermudaBhutanBoliviaBosnia and HerzegovinaBotswanaBrazilBritish Virgin IslandsBrunei DarussalamBulgariaBurkina FasoBurundiCabo VerdeCambodiaCameroonCanadaCaribbean small statesCayman IslandsCentral African RepublicCentral Europe and the BalticsChadChileChinaColombiaComorosCongo, Dem. Rep.Congo, Rep.Costa RicaCote d'IvoireCroatiaCubaCyprusCzech RepublicDenmarkDjiboutiDominicaDominican RepublicEarly-demographic dividendEast Asia & PacificEast Asia & Pacific (excluding high income)East Asia & Pacific (IDA & IBRD countries)EcuadorEgypt, Arab Rep.El SalvadorEquatorial GuineaEritreaEstoniaEthiopiaEuro areaEurope & Central AsiaEurope & Central Asia (excluding high income)Europe & Central Asia (IDA & IBRD countries)European UnionFijiFinlandFragile and conflict affected situationsFranceGabonGambia, TheGeorgiaGermanyGhanaGreeceGrenadaGuatemalaGuineaGuinea-BissauGuyanaHaitiHeavily indebted poor countries (HIPC)High incomeHondurasHong Kong SAR, ChinaHungaryIBRD onlyIcelandIDA & IBRD totalIDA blendIDA onlyIDA totalIndiaIndonesiaIran, Islamic Rep.IraqIrelandIsraelItalyJamaicaJapanJordanKazakhstanKenyaKiribatiKorea, Rep.KuwaitKyrgyz RepublicLao PDRLate-demographic dividendLatin America & Caribbean Latin America & Caribbean (excluding high income)Latin America & the Caribbean (IDA & IBRD countries)LatviaLeast developed countries: UN classificationLebanonLesothoLiberiaLibyaLiechtensteinLithuaniaLow & middle incomeLow incomeLower middle incomeLuxembourgMacao SAR, ChinaMacedonia, FYRMadagascarMalawiMalaysiaMaldivesMaliMaltaMauritaniaMauritiusMexicoMiddle East & North AfricaMiddle East & North Africa (excluding high income)Middle East & North Africa (IDA & IBRD countries)Middle incomeMoldovaMonacoMongoliaMontenegroMoroccoMozambiqueMyanmarNamibiaNauruNepalNetherlandsNew ZealandNicaraguaNigerNorwayOECD membersOmanOther small statesPacific island small statesPakistanPalauPanamaPapua New GuineaParaguayPeruPhilippinesPolandPortugalPost-demographic dividendPre-demographic dividendQatarRomaniaRussian FederationRwandaSamoaSan MarinoSao Tome and PrincipeSaudi ArabiaSenegalSerbiaSeychellesSierra LeoneSingaporeSint Maarten (Dutch part)Slovak RepublicSloveniaSmall statesSolomon IslandsSomaliaSouth AfricaSouth AsiaSouth Asia (IDA & IBRD)South SudanSpainSri LankaSt. Kitts and NevisSt. LuciaSt. Vincent and the GrenadinesSub-Saharan Africa Sub-Saharan Africa (excluding high income)Sub-Saharan Africa (IDA & IBRD countries)SudanSurinameSwazilandSwedenSwitzerlandSyrian Arab RepublicTajikistanTanzaniaThailandTimor-LesteTogoTongaTrinidad and TobagoTunisiaTurkeyTurks and Caicos IslandsTuvaluUgandaUkraineUnited Arab EmiratesUnited KingdomUpper middle incomeUruguayUzbekistanVanuatuVenezuela, RBVietnamWest Bank and GazaWorldYemen, Rep.ZambiaZimbabwe Timeline:
This timeline shows a graph from 1972 to 2015 of Pacific island small states. No data until 1971. Number of actual observations by date: 44.
Source name:
World Development Indicators
Source organization:
UNESCO Institute for Statistics
Categories, topics:
Education
Last updated:
apr 23, 2017
Indicators value changes by year
At the date of observation
Value
Absolute change
Change from previous value
jan 1, 1972
5.421
+5.421
0.0%
jan 1, 1973
5.389
-0.032
-0.58%
jan 1, 1974
5.282
-0.107
-1.99%
jan 1, 1975
5.064
-0.218
-4.12%
jan 1, 1976
5.051
-0.013
-0.26%
jan 1, 1977
5.042
-0.009
-0.18%
jan 1, 1978
5.054
+0.012
0.24%
jan 1, 1979
5.154
+0.1
1.99%
jan 1, 1980
4.328
-0.826
-16.03%
jan 1, 1981
4.802
+0.474
10.96%
jan 1, 1982
4.548
-0.254
-5.3%
jan 1, 1983
4.361
-0.187
-4.12%
jan 1, 1984
4.176
-0.184
-4.23%
jan 1, 1985
3.931
-0.246
-5.88%
jan 1, 1986
4.126
+0.195
4.97%
jan 1, 1987
4.143
+0.017
0.42%
jan 1, 1988
4.055
-0.088
-2.13%
jan 1, 1989
4.012
-0.042
-1.05%
jan 1, 1990
3.893
-0.12
-2.99%
jan 1, 1991
3.766
-0.126
-3.24%
jan 1, 1992
3.142
-0.625
-16.59%
jan 1, 1993
2.984
-0.157
-5.01%
jan 1, 1994
3.172
+0.187
6.28%
jan 1, 1995
3.834
+0.663
20.9%
jan 1, 1996
3.917
+0.082
2.15%
jan 1, 1997
3.726
-0.191
-4.87%
jan 1, 1998
3.704
-0.022
-0.59%
jan 1, 1999
3.679
-0.025
-0.68%
jan 1, 2000
3.636
-0.043
-1.16%
jan 1, 2001
3.514
-0.122
-3.36%
jan 1, 2002
3.025
-0.489
-13.91%
jan 1, 2003
3.401
+0.376
12.44%
jan 1, 2004
3.954
+0.553
16.26%
jan 1, 2005
4.482
+0.527
13.33%
jan 1, 2006
4.579
+0.098
2.18%
jan 1, 2007
4.717
+0.138
3.02%
jan 1, 2008
4.774
+0.057
1.21%
jan 1, 2009
4.623
-0.151
-3.17%
jan 1, 2010
4.562
-0.061
-1.32%
jan 1, 2011
4.486
-0.077
-1.68%
jan 1, 2012
4.875
+0.389
8.67%
jan 1, 2013
4.896
+0.022
0.45%
jan 1, 2014
4.626
-0.27
-5.52%
jan 1, 2015
4.707
+0.08
1.74%
Ranking of countries by current statistics by years


Comments: