29
/
en
AIzaSyAYiBZKx7MnpbEhh9jyipgxe19OcubqV5w
April 1, 2024
186975
Malawi
MWI
true
2
1
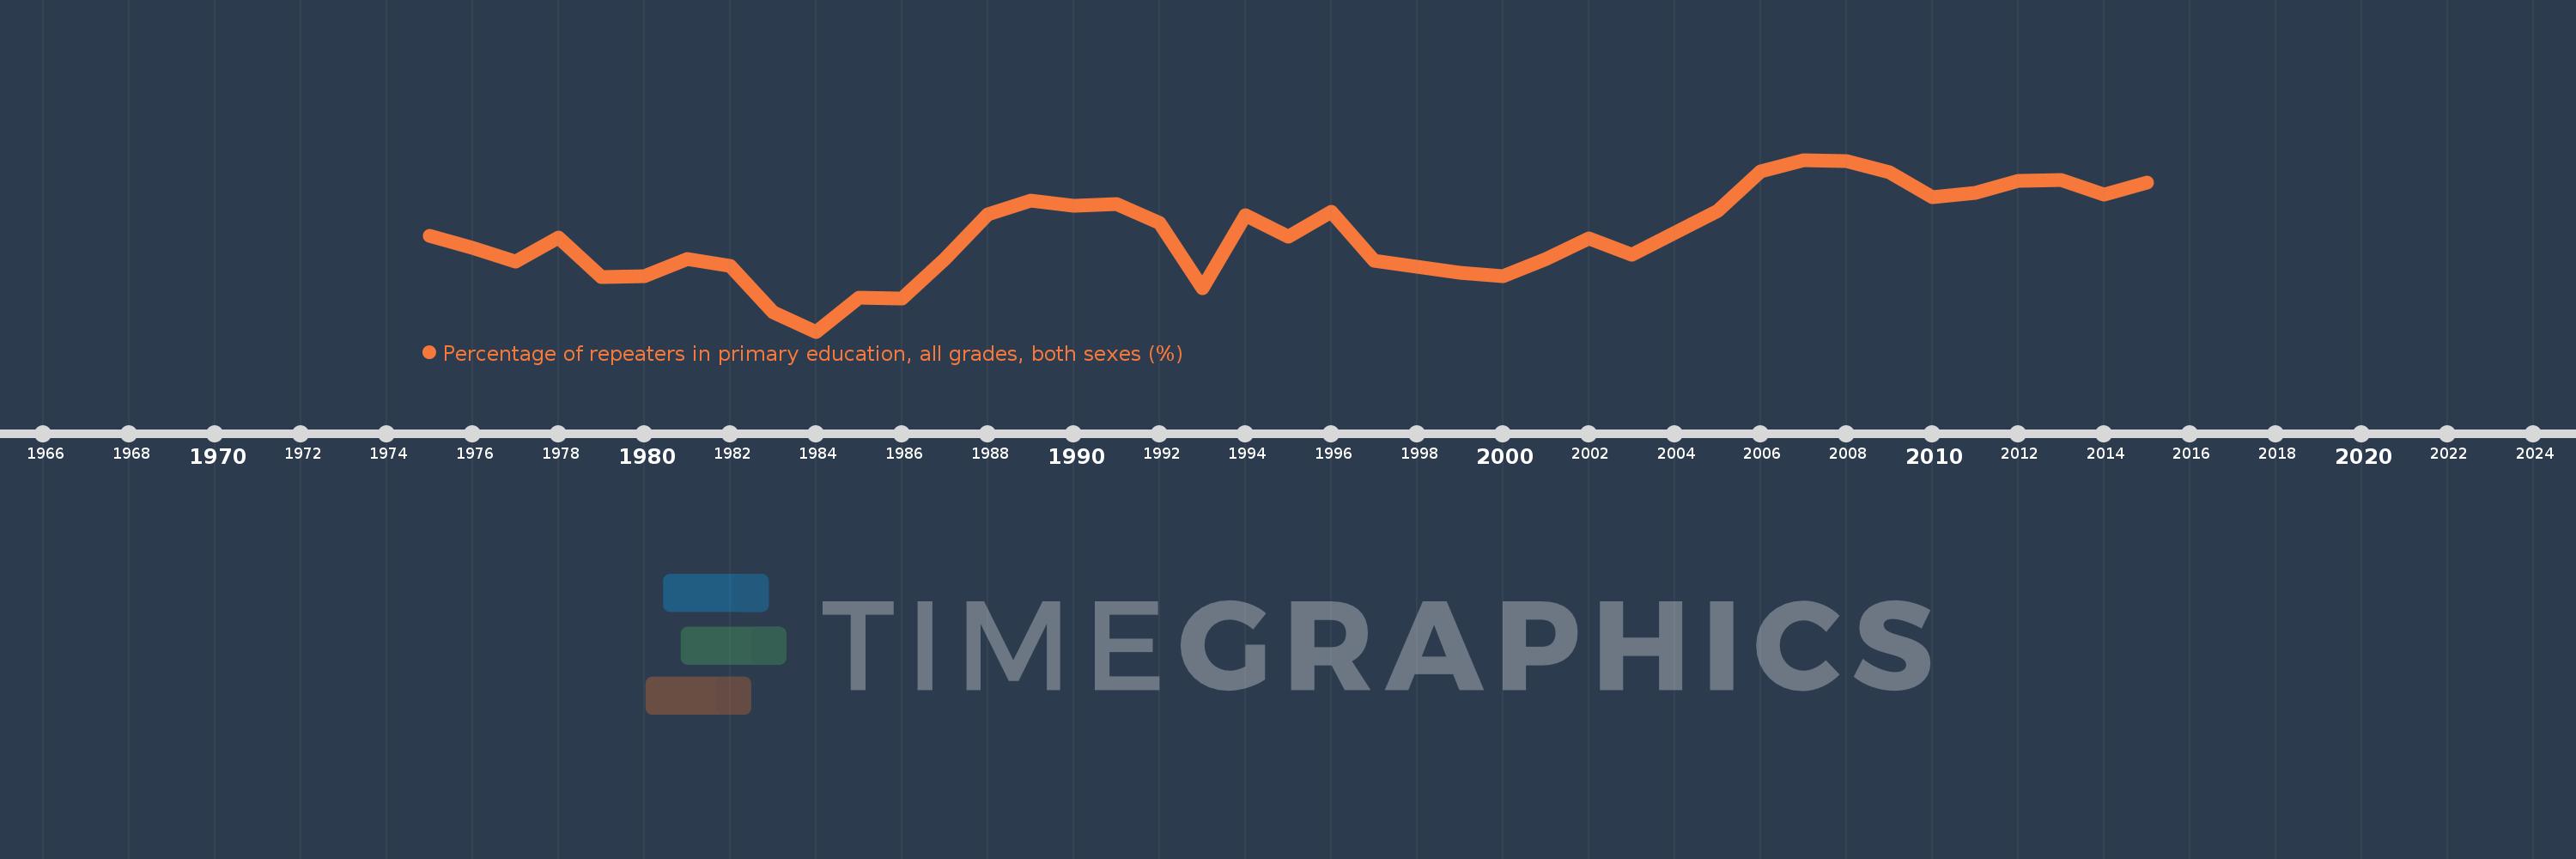
Percentage of repeaters in primary education, all grades, both sexes (%)
2015,2014,2013,2012,2011,2010,2009,2008,2007,2006,2005,2003,2002,2001,2000,1999,1997,1996,1995,1994,1993,1992,1991,1990,1989,1988,1987,1986,1985,1984,1983,1982,1981,1980,1979,1978,1977,1976,1975
This statistics in other country:
AfghanistanAlbaniaAlgeriaAndorraAngolaAntigua and BarbudaArab WorldArgentinaArmeniaArubaAustriaAzerbaijanBahamas, TheBahrainBangladeshBelarusBelgiumBelizeBeninBermudaBhutanBoliviaBosnia and HerzegovinaBotswanaBrazilBritish Virgin IslandsBrunei DarussalamBulgariaBurkina FasoBurundiCabo VerdeCambodiaCameroonCanadaCaribbean small statesCayman IslandsCentral African RepublicCentral Europe and the BalticsChadChileChinaColombiaComorosCongo, Dem. Rep.Congo, Rep.Costa RicaCote d'IvoireCroatiaCubaCyprusCzech RepublicDenmarkDjiboutiDominicaDominican RepublicEarly-demographic dividendEast Asia & PacificEast Asia & Pacific (excluding high income)East Asia & Pacific (IDA & IBRD countries)EcuadorEgypt, Arab Rep.El SalvadorEquatorial GuineaEritreaEstoniaEthiopiaEuro areaEurope & Central AsiaEurope & Central Asia (excluding high income)Europe & Central Asia (IDA & IBRD countries)European UnionFijiFinlandFragile and conflict affected situationsFranceGabonGambia, TheGeorgiaGermanyGhanaGreeceGrenadaGuatemalaGuineaGuinea-BissauGuyanaHaitiHeavily indebted poor countries (HIPC)High incomeHondurasHong Kong SAR, ChinaHungaryIBRD onlyIcelandIDA & IBRD totalIDA blendIDA onlyIDA totalIndiaIndonesiaIran, Islamic Rep.IraqIrelandIsraelItalyJamaicaJapanJordanKazakhstanKenyaKiribatiKorea, Rep.KuwaitKyrgyz RepublicLao PDRLate-demographic dividendLatin America & Caribbean Latin America & Caribbean (excluding high income)Latin America & the Caribbean (IDA & IBRD countries)LatviaLeast developed countries: UN classificationLebanonLesothoLiberiaLibyaLiechtensteinLithuaniaLow & middle incomeLow incomeLower middle incomeLuxembourgMacao SAR, ChinaMacedonia, FYRMadagascarMalawiMalaysiaMaldivesMaliMaltaMauritaniaMauritiusMexicoMiddle East & North AfricaMiddle East & North Africa (excluding high income)Middle East & North Africa (IDA & IBRD countries)Middle incomeMoldovaMonacoMongoliaMontenegroMoroccoMozambiqueMyanmarNamibiaNauruNepalNetherlandsNew ZealandNicaraguaNigerNorwayOECD membersOmanOther small statesPacific island small statesPakistanPalauPanamaPapua New GuineaParaguayPeruPhilippinesPolandPortugalPost-demographic dividendPre-demographic dividendQatarRomaniaRussian FederationRwandaSamoaSan MarinoSao Tome and PrincipeSaudi ArabiaSenegalSerbiaSeychellesSierra LeoneSingaporeSint Maarten (Dutch part)Slovak RepublicSloveniaSmall statesSolomon IslandsSomaliaSouth AfricaSouth AsiaSouth Asia (IDA & IBRD)South SudanSpainSri LankaSt. Kitts and NevisSt. LuciaSt. Vincent and the GrenadinesSub-Saharan Africa Sub-Saharan Africa (excluding high income)Sub-Saharan Africa (IDA & IBRD countries)SudanSurinameSwazilandSwedenSwitzerlandSyrian Arab RepublicTajikistanTanzaniaThailandTimor-LesteTogoTongaTrinidad and TobagoTunisiaTurkeyTurks and Caicos IslandsTuvaluUgandaUkraineUnited Arab EmiratesUnited KingdomUpper middle incomeUruguayUzbekistanVanuatuVenezuela, RBVietnamWest Bank and GazaWorldYemen, Rep.ZambiaZimbabwe Timeline:
This timeline shows a graph from 1975 to 2015 of Malawi. No data until 1974. Number of actual observations by date: 39.
Source name:
World Development Indicators
Source organization:
UNESCO Institute for Statistics
Categories, topics:
Education
Last updated:
apr 23, 2017
Indicators value changes by year
Minimum:
11.372
jan 1, 1984
Maximum:
20.771
jan 1, 2007
At the date of observation
Value
Absolute change
Change from previous value
jan 1, 1975
16.633
+16.633
0.0%
jan 1, 1976
15.961
-0.672
-4.04%
jan 1, 1977
15.207
-0.754
-4.72%
jan 1, 1978
16.499
+1.292
8.5%
jan 1, 1979
14.357
-2.142
-12.98%
jan 1, 1980
14.407
+0.05
0.35%
jan 1, 1981
15.327
+0.92
6.38%
jan 1, 1982
14.988
-0.339
-2.21%
jan 1, 1983
12.445
-2.543
-16.97%
jan 1, 1984
11.372
-1.073
-8.62%
jan 1, 1985
13.206
+1.834
16.13%
jan 1, 1986
13.197
-0.009
-0.07%
jan 1, 1987
15.363
+2.166
16.41%
jan 1, 1988
17.765
+2.402
15.64%
jan 1, 1989
18.531
+0.766
4.31%
jan 1, 1990
18.234
-0.297
-1.6%
jan 1, 1991
18.355
+0.12
0.66%
jan 1, 1992
17.312
-1.043
-5.68%
jan 1, 1993
13.739
-3.573
-20.64%
jan 1, 1994
17.746
+4.007
29.16%
jan 1, 1995
16.547
-1.199
-6.76%
jan 1, 1996
17.94
+1.394
8.42%
jan 1, 1997
15.226
-2.714
-15.13%
jan 1, 1999
14.605
-0.621
-4.08%
jan 1, 2000
14.418
-0.187
-1.28%
jan 1, 2001
15.354
+0.937
6.5%
jan 1, 2002
16.462
+1.108
7.22%
jan 1, 2003
15.574
-0.889
-5.4%
jan 1, 2005
17.991
+2.417
15.52%
jan 1, 2006
20.157
+2.166
12.04%
jan 1, 2007
20.771
+0.613
3.04%
jan 1, 2008
20.679
-0.092
-0.44%
jan 1, 2009
20.074
-0.605
-2.93%
jan 1, 2010
18.725
-1.349
-6.72%
jan 1, 2011
18.965
+0.24
1.28%
jan 1, 2012
19.617
+0.652
3.44%
jan 1, 2013
19.679
+0.062
0.32%
jan 1, 2014
18.883
-0.796
-4.05%
jan 1, 2015
19.53
+0.648
3.43%
Ranking of countries by current statistics by years


Comments: