29
/
en
AIzaSyAYiBZKx7MnpbEhh9jyipgxe19OcubqV5w
April 1, 2024
46464
Low income
LIC
false
2
1
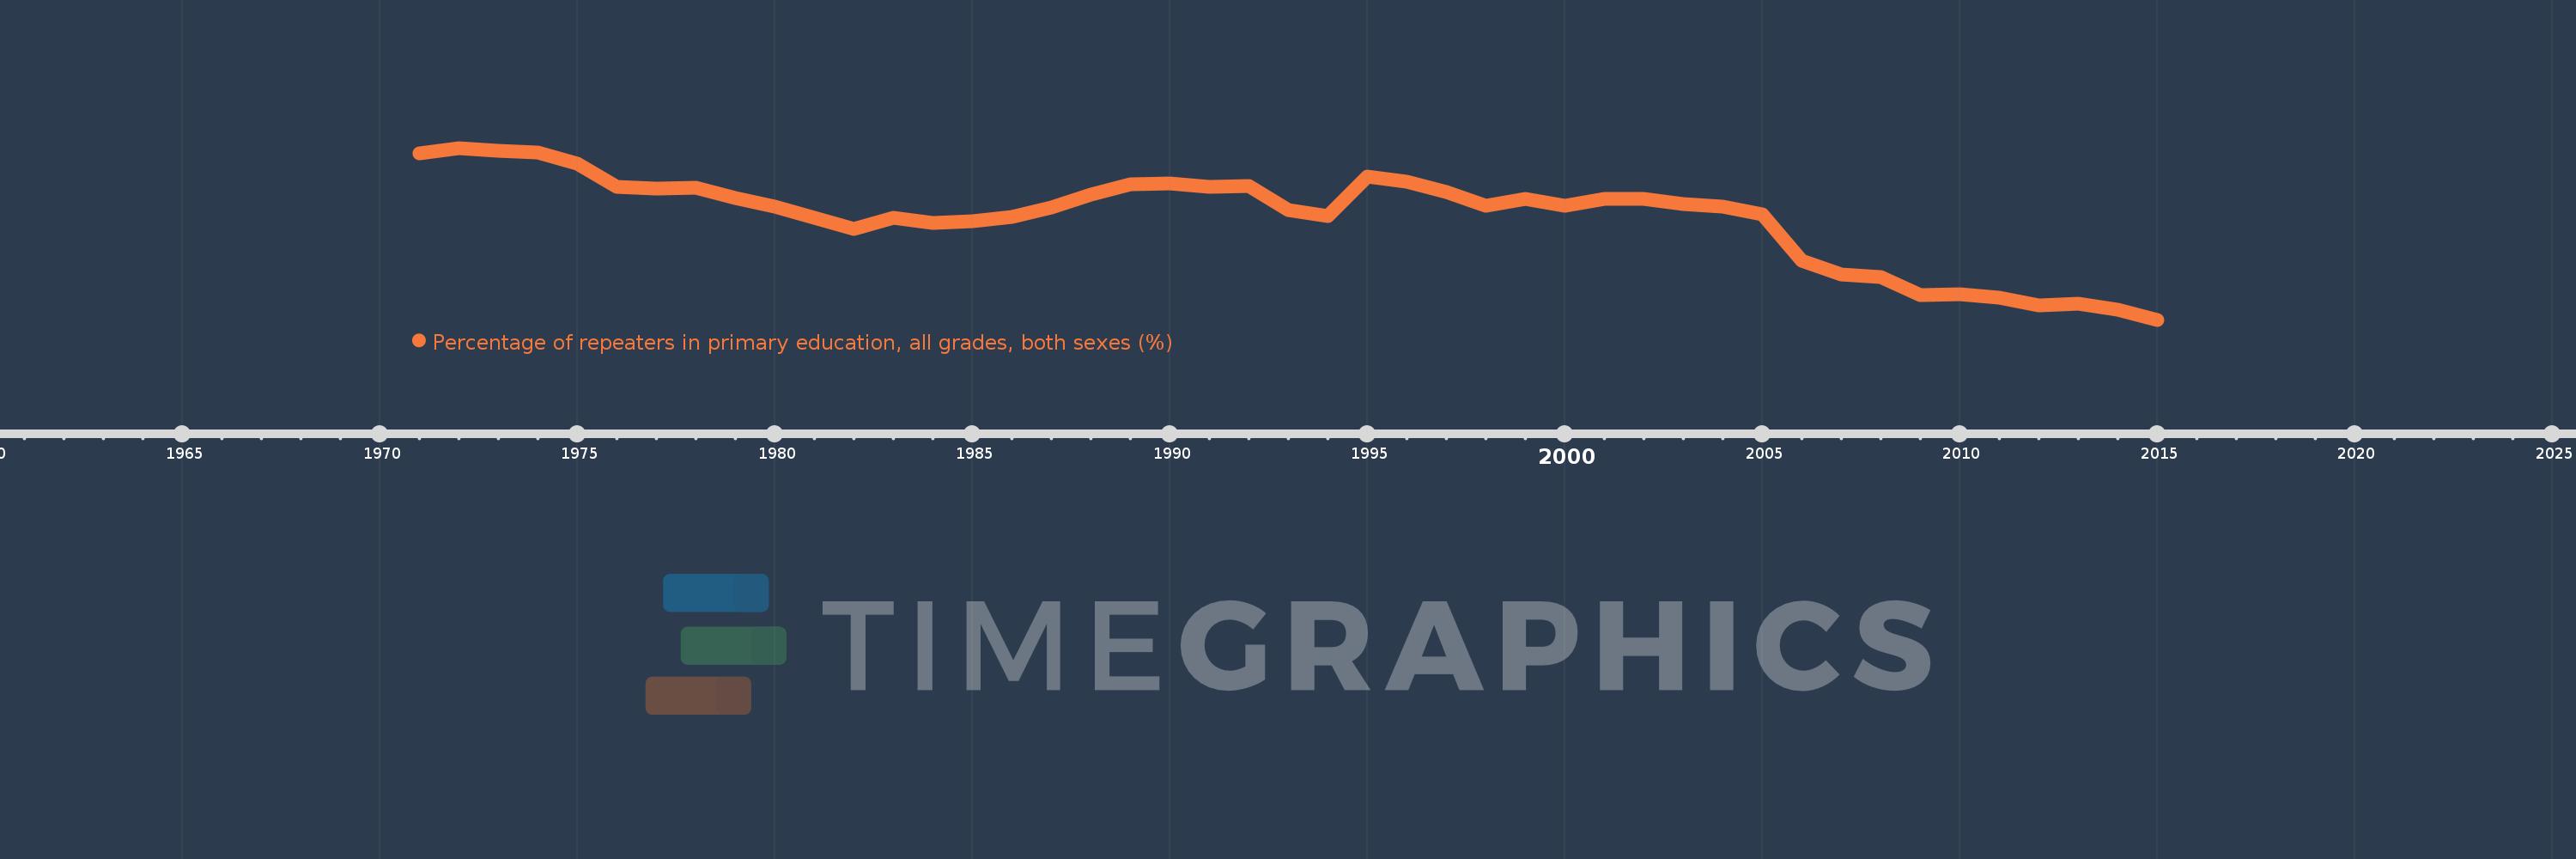
Percentage of repeaters in primary education, all grades, both sexes (%)
2015,2014,2013,2012,2011,2010,2009,2008,2007,2006,2005,2004,2003,2002,2001,2000,1999,1998,1997,1996,1995,1994,1993,1992,1991,1990,1989,1988,1987,1986,1985,1984,1983,1982,1981,1980,1979,1978,1977,1976,1975,1974,1973,1972,1971
This statistics in other country:
AfghanistanAlbaniaAlgeriaAndorraAngolaAntigua and BarbudaArab WorldArgentinaArmeniaArubaAustriaAzerbaijanBahamas, TheBahrainBangladeshBelarusBelgiumBelizeBeninBermudaBhutanBoliviaBosnia and HerzegovinaBotswanaBrazilBritish Virgin IslandsBrunei DarussalamBulgariaBurkina FasoBurundiCabo VerdeCambodiaCameroonCanadaCaribbean small statesCayman IslandsCentral African RepublicCentral Europe and the BalticsChadChileChinaColombiaComorosCongo, Dem. Rep.Congo, Rep.Costa RicaCote d'IvoireCroatiaCubaCyprusCzech RepublicDenmarkDjiboutiDominicaDominican RepublicEarly-demographic dividendEast Asia & PacificEast Asia & Pacific (excluding high income)East Asia & Pacific (IDA & IBRD countries)EcuadorEgypt, Arab Rep.El SalvadorEquatorial GuineaEritreaEstoniaEthiopiaEuro areaEurope & Central AsiaEurope & Central Asia (excluding high income)Europe & Central Asia (IDA & IBRD countries)European UnionFijiFinlandFragile and conflict affected situationsFranceGabonGambia, TheGeorgiaGermanyGhanaGreeceGrenadaGuatemalaGuineaGuinea-BissauGuyanaHaitiHeavily indebted poor countries (HIPC)High incomeHondurasHong Kong SAR, ChinaHungaryIBRD onlyIcelandIDA & IBRD totalIDA blendIDA onlyIDA totalIndiaIndonesiaIran, Islamic Rep.IraqIrelandIsraelItalyJamaicaJapanJordanKazakhstanKenyaKiribatiKorea, Rep.KuwaitKyrgyz RepublicLao PDRLate-demographic dividendLatin America & Caribbean Latin America & Caribbean (excluding high income)Latin America & the Caribbean (IDA & IBRD countries)LatviaLeast developed countries: UN classificationLebanonLesothoLiberiaLibyaLiechtensteinLithuaniaLow & middle incomeLow incomeLower middle incomeLuxembourgMacao SAR, ChinaMacedonia, FYRMadagascarMalawiMalaysiaMaldivesMaliMaltaMauritaniaMauritiusMexicoMiddle East & North AfricaMiddle East & North Africa (excluding high income)Middle East & North Africa (IDA & IBRD countries)Middle incomeMoldovaMonacoMongoliaMontenegroMoroccoMozambiqueMyanmarNamibiaNauruNepalNetherlandsNew ZealandNicaraguaNigerNorwayOECD membersOmanOther small statesPacific island small statesPakistanPalauPanamaPapua New GuineaParaguayPeruPhilippinesPolandPortugalPost-demographic dividendPre-demographic dividendQatarRomaniaRussian FederationRwandaSamoaSan MarinoSao Tome and PrincipeSaudi ArabiaSenegalSerbiaSeychellesSierra LeoneSingaporeSint Maarten (Dutch part)Slovak RepublicSloveniaSmall statesSolomon IslandsSomaliaSouth AfricaSouth AsiaSouth Asia (IDA & IBRD)South SudanSpainSri LankaSt. Kitts and NevisSt. LuciaSt. Vincent and the GrenadinesSub-Saharan Africa Sub-Saharan Africa (excluding high income)Sub-Saharan Africa (IDA & IBRD countries)SudanSurinameSwazilandSwedenSwitzerlandSyrian Arab RepublicTajikistanTanzaniaThailandTimor-LesteTogoTongaTrinidad and TobagoTunisiaTurkeyTurks and Caicos IslandsTuvaluUgandaUkraineUnited Arab EmiratesUnited KingdomUpper middle incomeUruguayUzbekistanVanuatuVenezuela, RBVietnamWest Bank and GazaWorldYemen, Rep.ZambiaZimbabwe Timeline:
This timeline shows a graph from 1971 to 2015 of Low income. No data until 1970. Number of actual observations by date: 45.
Source name:
World Development Indicators
Source organization:
UNESCO Institute for Statistics
Categories, topics:
Education
Last updated:
apr 23, 2017
Indicators value changes by year
Minimum:
10.238
jan 1, 2015
Maximum:
16.668
jan 1, 1972
At the date of observation
Value
Absolute change
Change from previous value
jan 1, 1971
16.475
+16.475
0.0%
jan 1, 1972
16.668
+0.193
1.17%
jan 1, 1973
16.567
-0.101
-0.6%
jan 1, 1974
16.487
-0.081
-0.49%
jan 1, 1975
16.087
-0.399
-2.42%
jan 1, 1976
15.211
-0.876
-5.45%
jan 1, 1977
15.161
-0.051
-0.33%
jan 1, 1978
15.191
+0.03
0.2%
jan 1, 1979
14.8
-0.391
-2.57%
jan 1, 1980
14.483
-0.317
-2.14%
jan 1, 1981
14.043
-0.44
-3.04%
jan 1, 1982
13.631
-0.412
-2.93%
jan 1, 1983
14.044
+0.414
3.04%
jan 1, 1984
13.857
-0.187
-1.33%
jan 1, 1985
13.915
+0.058
0.42%
jan 1, 1986
14.099
+0.184
1.32%
jan 1, 1987
14.456
+0.358
2.54%
jan 1, 1988
14.911
+0.454
3.14%
jan 1, 1989
15.313
+0.403
2.7%
jan 1, 1990
15.326
+0.012
0.08%
jan 1, 1991
15.212
-0.114
-0.74%
jan 1, 1992
15.257
+0.045
0.29%
jan 1, 1993
14.354
-0.902
-5.92%
jan 1, 1994
14.109
-0.245
-1.71%
jan 1, 1995
15.6
+1.491
10.57%
jan 1, 1996
15.408
-0.191
-1.23%
jan 1, 1997
15.01
-0.398
-2.59%
jan 1, 1998
14.497
-0.513
-3.42%
jan 1, 1999
14.768
+0.271
1.87%
jan 1, 2000
14.514
-0.254
-1.72%
jan 1, 2001
14.771
+0.257
1.77%
jan 1, 2002
14.748
-0.023
-0.16%
jan 1, 2003
14.553
-0.195
-1.32%
jan 1, 2004
14.484
-0.068
-0.47%
jan 1, 2005
14.187
-0.297
-2.05%
jan 1, 2006
12.435
-1.752
-12.35%
jan 1, 2007
11.932
-0.502
-4.04%
jan 1, 2008
11.823
-0.109
-0.92%
jan 1, 2009
11.172
-0.651
-5.51%
jan 1, 2010
11.206
+0.034
0.31%
jan 1, 2011
11.064
-0.143
-1.27%
jan 1, 2012
10.776
-0.287
-2.59%
jan 1, 2013
10.837
+0.061
0.56%
jan 1, 2014
10.602
-0.235
-2.17%
jan 1, 2015
10.238
-0.364
-3.43%
Ranking of countries by current statistics by years


Comments: