29
/
en
AIzaSyAYiBZKx7MnpbEhh9jyipgxe19OcubqV5w
April 1, 2024
43769
Latin America & the Caribbean (IDA & IBRD countries)
TLA
false
2
1
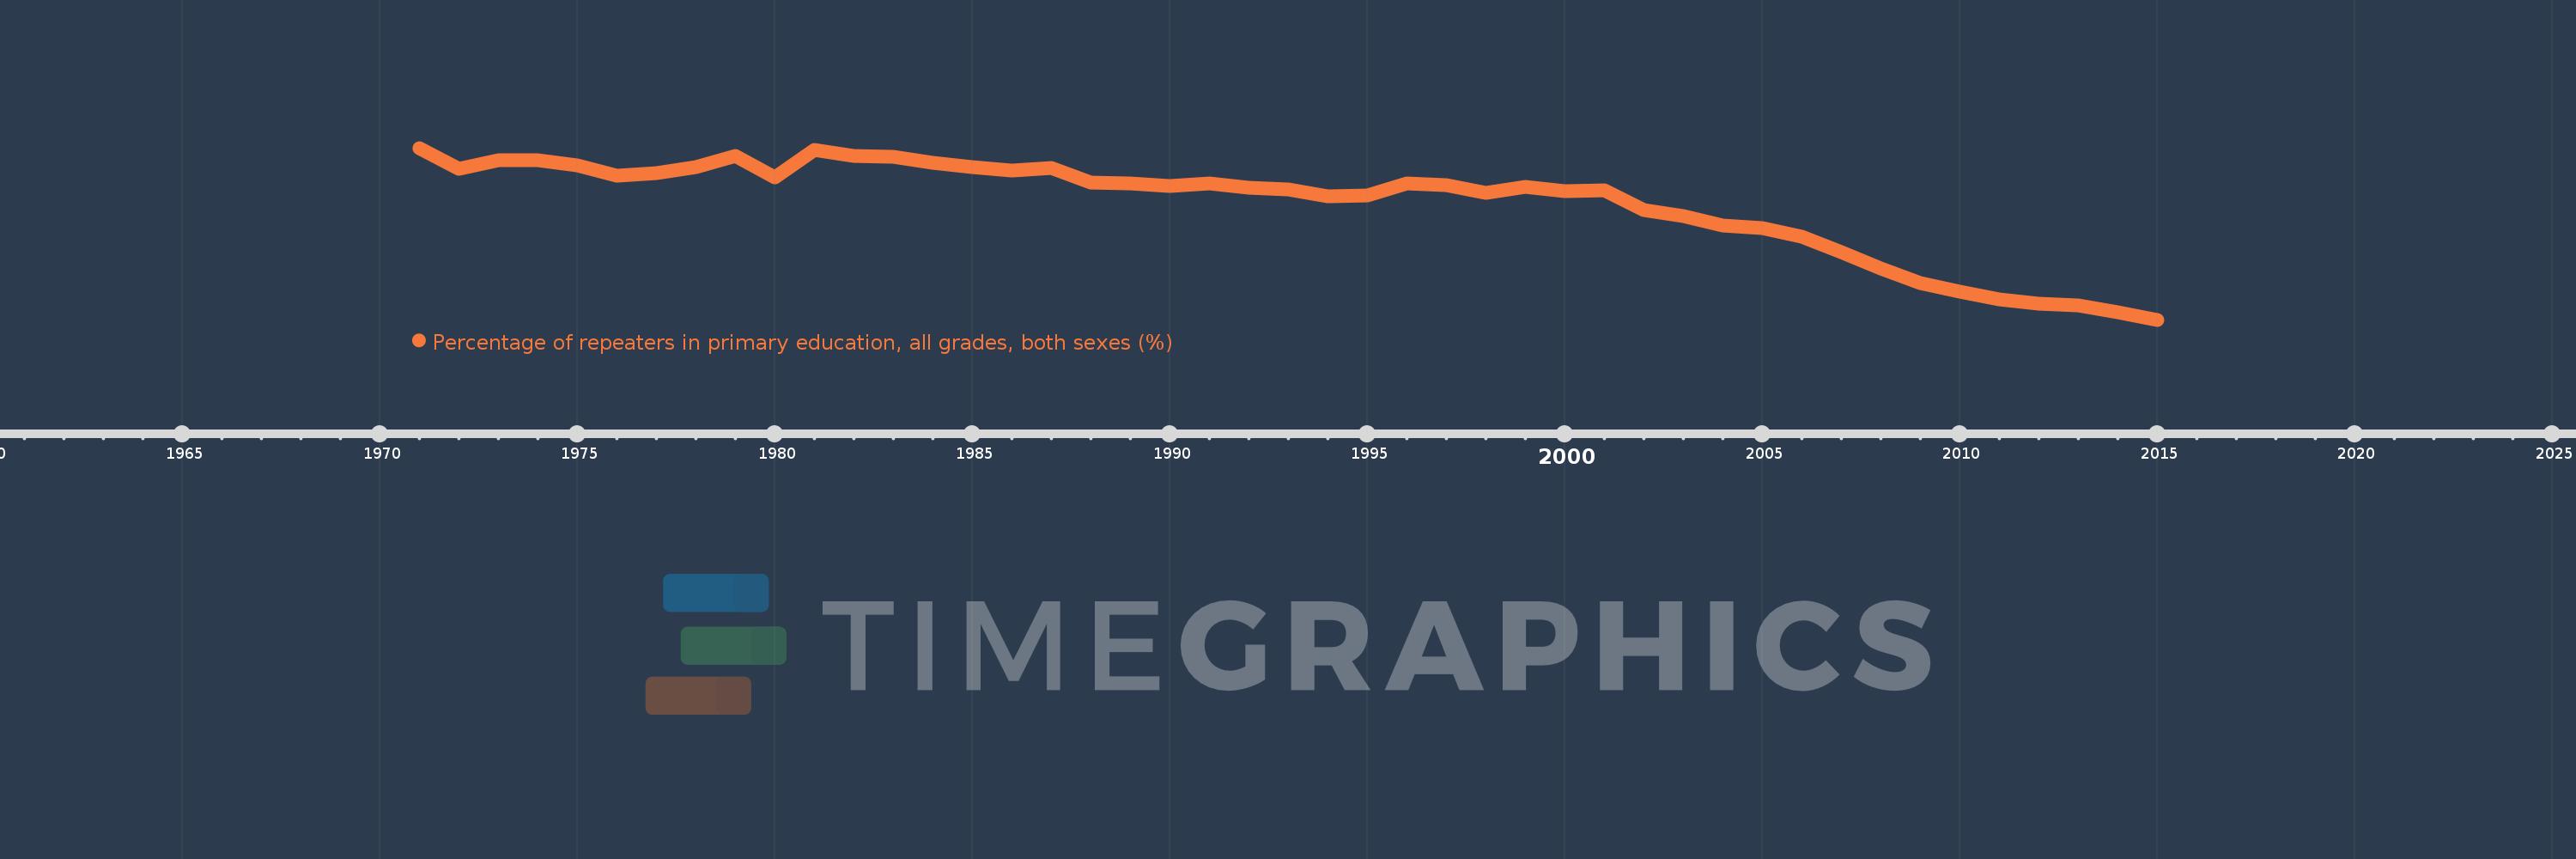
Percentage of repeaters in primary education, all grades, both sexes (%)
2015,2014,2013,2012,2011,2010,2009,2008,2007,2006,2005,2004,2003,2002,2001,2000,1999,1998,1997,1996,1995,1994,1993,1992,1991,1990,1989,1988,1987,1986,1985,1984,1983,1982,1981,1980,1979,1978,1977,1976,1975,1974,1973,1972,1971
This statistics in other country:
AfghanistanAlbaniaAlgeriaAndorraAngolaAntigua and BarbudaArab WorldArgentinaArmeniaArubaAustriaAzerbaijanBahamas, TheBahrainBangladeshBelarusBelgiumBelizeBeninBermudaBhutanBoliviaBosnia and HerzegovinaBotswanaBrazilBritish Virgin IslandsBrunei DarussalamBulgariaBurkina FasoBurundiCabo VerdeCambodiaCameroonCanadaCaribbean small statesCayman IslandsCentral African RepublicCentral Europe and the BalticsChadChileChinaColombiaComorosCongo, Dem. Rep.Congo, Rep.Costa RicaCote d'IvoireCroatiaCubaCyprusCzech RepublicDenmarkDjiboutiDominicaDominican RepublicEarly-demographic dividendEast Asia & PacificEast Asia & Pacific (excluding high income)East Asia & Pacific (IDA & IBRD countries)EcuadorEgypt, Arab Rep.El SalvadorEquatorial GuineaEritreaEstoniaEthiopiaEuro areaEurope & Central AsiaEurope & Central Asia (excluding high income)Europe & Central Asia (IDA & IBRD countries)European UnionFijiFinlandFragile and conflict affected situationsFranceGabonGambia, TheGeorgiaGermanyGhanaGreeceGrenadaGuatemalaGuineaGuinea-BissauGuyanaHaitiHeavily indebted poor countries (HIPC)High incomeHondurasHong Kong SAR, ChinaHungaryIBRD onlyIcelandIDA & IBRD totalIDA blendIDA onlyIDA totalIndiaIndonesiaIran, Islamic Rep.IraqIrelandIsraelItalyJamaicaJapanJordanKazakhstanKenyaKiribatiKorea, Rep.KuwaitKyrgyz RepublicLao PDRLate-demographic dividendLatin America & Caribbean Latin America & Caribbean (excluding high income)Latin America & the Caribbean (IDA & IBRD countries)LatviaLeast developed countries: UN classificationLebanonLesothoLiberiaLibyaLiechtensteinLithuaniaLow & middle incomeLow incomeLower middle incomeLuxembourgMacao SAR, ChinaMacedonia, FYRMadagascarMalawiMalaysiaMaldivesMaliMaltaMauritaniaMauritiusMexicoMiddle East & North AfricaMiddle East & North Africa (excluding high income)Middle East & North Africa (IDA & IBRD countries)Middle incomeMoldovaMonacoMongoliaMontenegroMoroccoMozambiqueMyanmarNamibiaNauruNepalNetherlandsNew ZealandNicaraguaNigerNorwayOECD membersOmanOther small statesPacific island small statesPakistanPalauPanamaPapua New GuineaParaguayPeruPhilippinesPolandPortugalPost-demographic dividendPre-demographic dividendQatarRomaniaRussian FederationRwandaSamoaSan MarinoSao Tome and PrincipeSaudi ArabiaSenegalSerbiaSeychellesSierra LeoneSingaporeSint Maarten (Dutch part)Slovak RepublicSloveniaSmall statesSolomon IslandsSomaliaSouth AfricaSouth AsiaSouth Asia (IDA & IBRD)South SudanSpainSri LankaSt. Kitts and NevisSt. LuciaSt. Vincent and the GrenadinesSub-Saharan Africa Sub-Saharan Africa (excluding high income)Sub-Saharan Africa (IDA & IBRD countries)SudanSurinameSwazilandSwedenSwitzerlandSyrian Arab RepublicTajikistanTanzaniaThailandTimor-LesteTogoTongaTrinidad and TobagoTunisiaTurkeyTurks and Caicos IslandsTuvaluUgandaUkraineUnited Arab EmiratesUnited KingdomUpper middle incomeUruguayUzbekistanVanuatuVenezuela, RBVietnamWest Bank and GazaWorldYemen, Rep.ZambiaZimbabwe Timeline:
This timeline shows a graph from 1971 to 2015 of Latin America & the Caribbean (IDA & IBRD countries). No data until 1970. Number of actual observations by date: 45.
Source name:
World Development Indicators
Source organization:
UNESCO Institute for Statistics
Categories, topics:
Education
Last updated:
apr 23, 2017
Indicators value changes by year
Maximum:
14.672
jan 1, 1971
At the date of observation
Value
Absolute change
Change from previous value
jan 1, 1971
14.672
+14.672
0.0%
jan 1, 1972
13.481
-1.191
-8.12%
jan 1, 1973
13.987
+0.505
3.75%
jan 1, 1974
13.962
-0.024
-0.17%
jan 1, 1975
13.65
-0.313
-2.24%
jan 1, 1976
13.059
-0.591
-4.33%
jan 1, 1977
13.254
+0.196
1.5%
jan 1, 1978
13.575
+0.321
2.42%
jan 1, 1979
14.2
+0.625
4.61%
jan 1, 1980
13.004
-1.196
-8.42%
jan 1, 1981
14.548
+1.544
11.87%
jan 1, 1982
14.19
-0.359
-2.47%
jan 1, 1983
14.165
-0.025
-0.18%
jan 1, 1984
13.839
-0.325
-2.3%
jan 1, 1985
13.599
-0.241
-1.74%
jan 1, 1986
13.361
-0.237
-1.74%
jan 1, 1987
13.523
+0.161
1.21%
jan 1, 1988
12.709
-0.814
-6.02%
jan 1, 1989
12.645
-0.064
-0.5%
jan 1, 1990
12.502
-0.143
-1.13%
jan 1, 1991
12.616
+0.114
0.91%
jan 1, 1992
12.373
-0.242
-1.92%
jan 1, 1993
12.309
-0.064
-0.52%
jan 1, 1994
11.9
-0.409
-3.32%
jan 1, 1995
11.972
+0.072
0.61%
jan 1, 1996
12.617
+0.645
5.39%
jan 1, 1997
12.526
-0.091
-0.72%
jan 1, 1998
12.102
-0.424
-3.38%
jan 1, 1999
12.447
+0.344
2.85%
jan 1, 2000
12.177
-0.269
-2.16%
jan 1, 2001
12.267
+0.09
0.74%
jan 1, 2002
11.093
-1.174
-9.57%
jan 1, 2003
10.787
-0.306
-2.76%
jan 1, 2004
10.207
-0.58
-5.37%
jan 1, 2005
10.095
-0.112
-1.1%
jan 1, 2006
9.598
-0.497
-4.92%
jan 1, 2007
8.726
-0.872
-9.09%
jan 1, 2008
7.783
-0.942
-10.8%
jan 1, 2009
6.927
-0.856
-11.0%
jan 1, 2010
6.456
-0.471
-6.8%
jan 1, 2011
5.998
-0.457
-7.09%
jan 1, 2012
5.753
-0.246
-4.09%
jan 1, 2013
5.652
-0.101
-1.75%
jan 1, 2014
5.263
-0.389
-6.89%
jan 1, 2015
4.828
-0.436
-8.28%
Ranking of countries by current statistics by years


Comments: