29
/
en
AIzaSyAYiBZKx7MnpbEhh9jyipgxe19OcubqV5w
April 1, 2024
221311
Paraguay
PRY
true
2
1
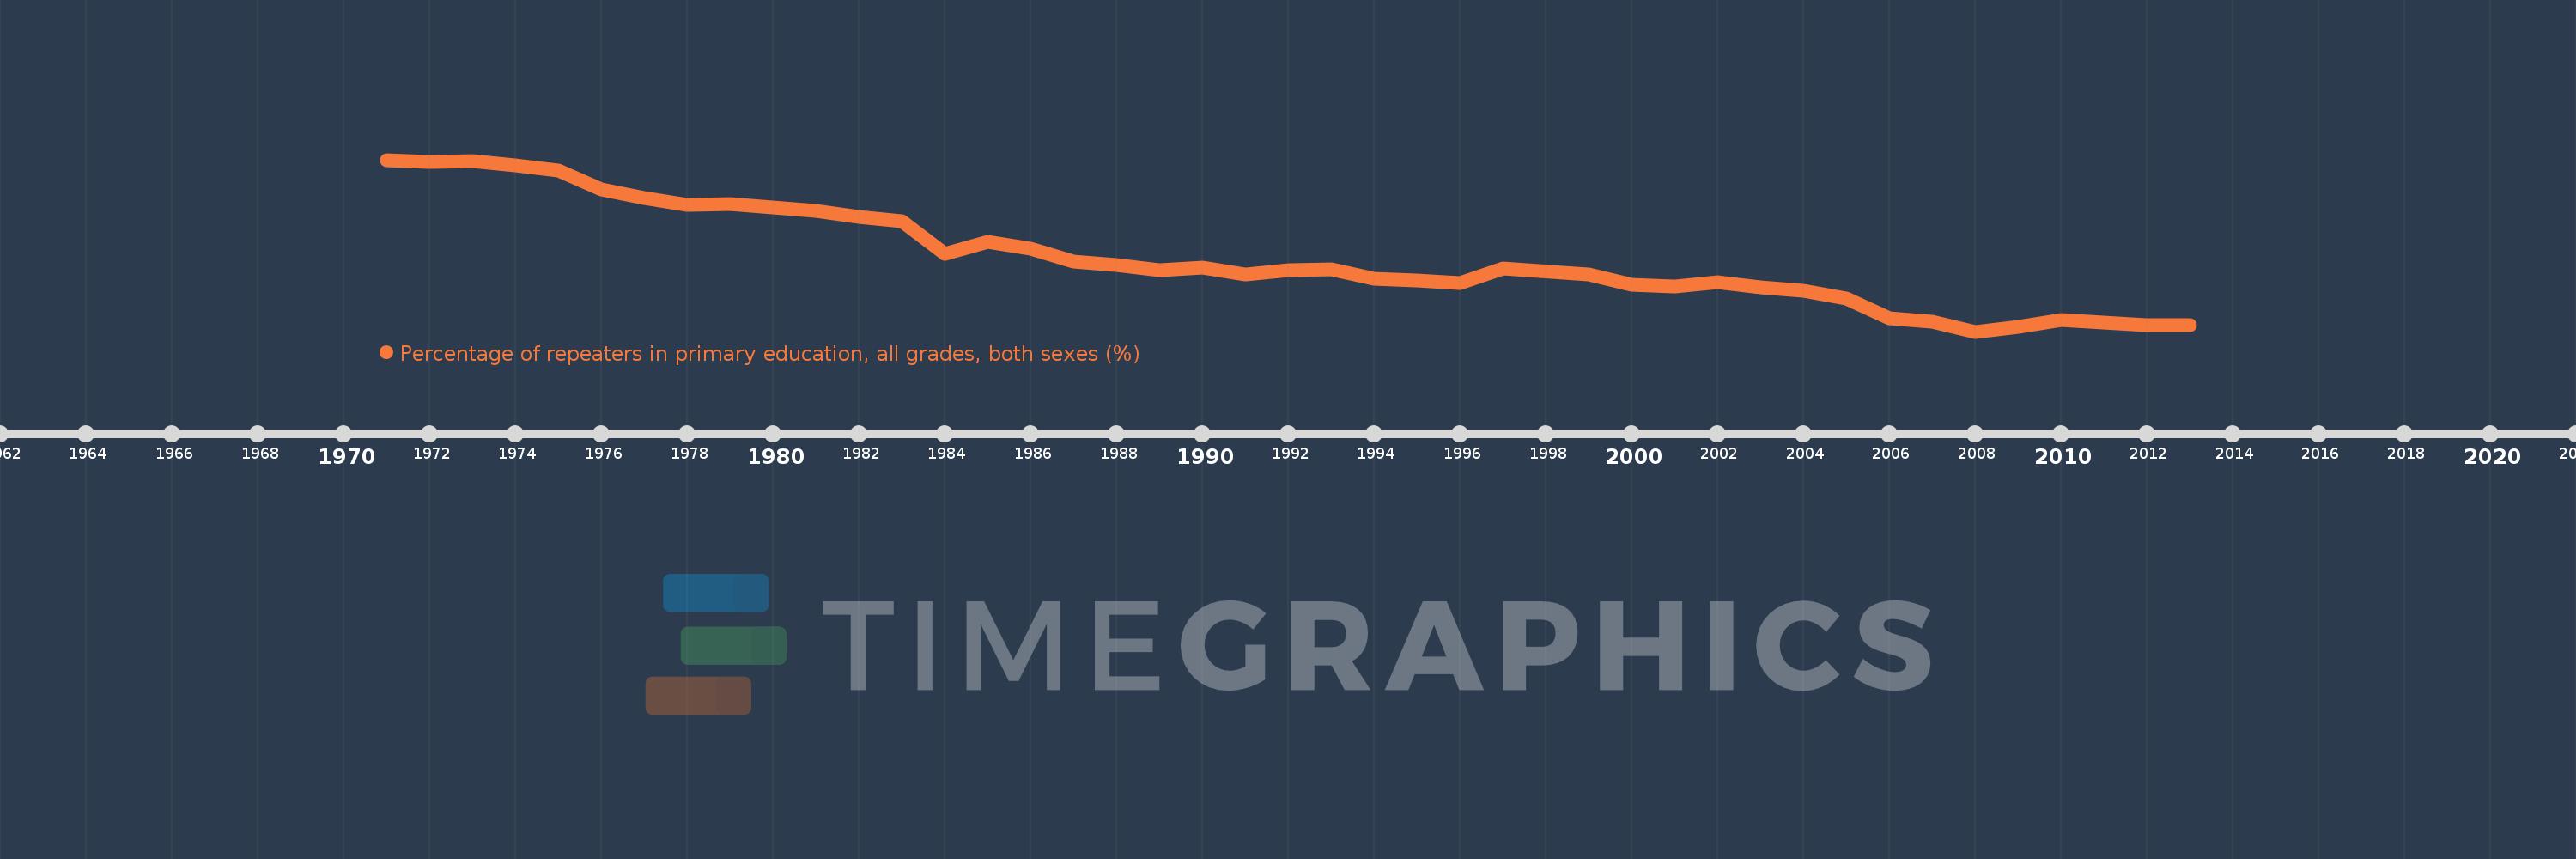
Percentage of repeaters in primary education, all grades, both sexes (%)
2013,2012,2011,2010,2009,2008,2007,2006,2005,2004,2003,2002,2001,2000,1999,1997,1996,1995,1994,1993,1992,1991,1990,1989,1988,1987,1986,1985,1984,1983,1982,1981,1979,1978,1977,1976,1975,1974,1973,1972,1971
This statistics in other country:
AfghanistanAlbaniaAlgeriaAndorraAngolaAntigua and BarbudaArab WorldArgentinaArmeniaArubaAustriaAzerbaijanBahamas, TheBahrainBangladeshBelarusBelgiumBelizeBeninBermudaBhutanBoliviaBosnia and HerzegovinaBotswanaBrazilBritish Virgin IslandsBrunei DarussalamBulgariaBurkina FasoBurundiCabo VerdeCambodiaCameroonCanadaCaribbean small statesCayman IslandsCentral African RepublicCentral Europe and the BalticsChadChileChinaColombiaComorosCongo, Dem. Rep.Congo, Rep.Costa RicaCote d'IvoireCroatiaCubaCyprusCzech RepublicDenmarkDjiboutiDominicaDominican RepublicEarly-demographic dividendEast Asia & PacificEast Asia & Pacific (excluding high income)East Asia & Pacific (IDA & IBRD countries)EcuadorEgypt, Arab Rep.El SalvadorEquatorial GuineaEritreaEstoniaEthiopiaEuro areaEurope & Central AsiaEurope & Central Asia (excluding high income)Europe & Central Asia (IDA & IBRD countries)European UnionFijiFinlandFragile and conflict affected situationsFranceGabonGambia, TheGeorgiaGermanyGhanaGreeceGrenadaGuatemalaGuineaGuinea-BissauGuyanaHaitiHeavily indebted poor countries (HIPC)High incomeHondurasHong Kong SAR, ChinaHungaryIBRD onlyIcelandIDA & IBRD totalIDA blendIDA onlyIDA totalIndiaIndonesiaIran, Islamic Rep.IraqIrelandIsraelItalyJamaicaJapanJordanKazakhstanKenyaKiribatiKorea, Rep.KuwaitKyrgyz RepublicLao PDRLate-demographic dividendLatin America & Caribbean Latin America & Caribbean (excluding high income)Latin America & the Caribbean (IDA & IBRD countries)LatviaLeast developed countries: UN classificationLebanonLesothoLiberiaLibyaLiechtensteinLithuaniaLow & middle incomeLow incomeLower middle incomeLuxembourgMacao SAR, ChinaMacedonia, FYRMadagascarMalawiMalaysiaMaldivesMaliMaltaMauritaniaMauritiusMexicoMiddle East & North AfricaMiddle East & North Africa (excluding high income)Middle East & North Africa (IDA & IBRD countries)Middle incomeMoldovaMonacoMongoliaMontenegroMoroccoMozambiqueMyanmarNamibiaNauruNepalNetherlandsNew ZealandNicaraguaNigerNorwayOECD membersOmanOther small statesPacific island small statesPakistanPalauPanamaPapua New GuineaParaguayPeruPhilippinesPolandPortugalPost-demographic dividendPre-demographic dividendQatarRomaniaRussian FederationRwandaSamoaSan MarinoSao Tome and PrincipeSaudi ArabiaSenegalSerbiaSeychellesSierra LeoneSingaporeSint Maarten (Dutch part)Slovak RepublicSloveniaSmall statesSolomon IslandsSomaliaSouth AfricaSouth AsiaSouth Asia (IDA & IBRD)South SudanSpainSri LankaSt. Kitts and NevisSt. LuciaSt. Vincent and the GrenadinesSub-Saharan Africa Sub-Saharan Africa (excluding high income)Sub-Saharan Africa (IDA & IBRD countries)SudanSurinameSwazilandSwedenSwitzerlandSyrian Arab RepublicTajikistanTanzaniaThailandTimor-LesteTogoTongaTrinidad and TobagoTunisiaTurkeyTurks and Caicos IslandsTuvaluUgandaUkraineUnited Arab EmiratesUnited KingdomUpper middle incomeUruguayUzbekistanVanuatuVenezuela, RBVietnamWest Bank and GazaWorldYemen, Rep.ZambiaZimbabwe Timeline:
This timeline shows a graph from 1971 to 2013 of Paraguay. No data until 1970. Number of actual observations by date: 41.
Source name:
World Development Indicators
Source organization:
UNESCO Institute for Statistics
Categories, topics:
Education
Last updated:
apr 23, 2017
Indicators value changes by year
Maximum:
17.668
jan 1, 1971
At the date of observation
Value
Absolute change
Change from previous value
jan 1, 1971
17.668
+17.668
0.0%
jan 1, 1972
17.495
-0.173
-0.98%
jan 1, 1973
17.532
+0.037
0.21%
jan 1, 1974
17.195
-0.337
-1.92%
jan 1, 1975
16.784
-0.411
-2.39%
jan 1, 1976
15.341
-1.444
-8.6%
jan 1, 1977
14.673
-0.667
-4.35%
jan 1, 1978
14.119
-0.555
-3.78%
jan 1, 1979
14.146
+0.027
0.19%
jan 1, 1981
13.6
-0.546
-3.86%
jan 1, 1982
13.159
-0.441
-3.24%
jan 1, 1983
12.828
-0.331
-2.52%
jan 1, 1984
10.231
-2.597
-20.25%
jan 1, 1985
11.175
+0.945
9.23%
jan 1, 1986
10.599
-0.576
-5.16%
jan 1, 1987
9.584
-1.015
-9.58%
jan 1, 1988
9.342
-0.242
-2.52%
jan 1, 1989
8.933
-0.41
-4.38%
jan 1, 1990
9.105
+0.172
1.92%
jan 1, 1991
8.555
-0.55
-6.04%
jan 1, 1992
8.895
+0.341
3.98%
jan 1, 1993
8.974
+0.078
0.88%
jan 1, 1994
8.26
-0.713
-7.95%
jan 1, 1995
8.114
-0.147
-1.78%
jan 1, 1996
7.918
-0.196
-2.41%
jan 1, 1997
9.09
+1.172
14.81%
jan 1, 1999
8.558
-0.533
-5.86%
jan 1, 2000
7.786
-0.772
-9.02%
jan 1, 2001
7.651
-0.134
-1.73%
jan 1, 2002
7.986
+0.335
4.38%
jan 1, 2003
7.579
-0.408
-5.11%
jan 1, 2004
7.296
-0.282
-3.73%
jan 1, 2005
6.701
-0.595
-8.15%
jan 1, 2006
5.118
-1.583
-23.63%
jan 1, 2007
4.845
-0.273
-5.34%
jan 1, 2008
4.062
-0.783
-16.16%
jan 1, 2009
4.455
+0.393
9.68%
jan 1, 2010
4.974
+0.519
11.64%
jan 1, 2011
4.788
-0.186
-3.73%
jan 1, 2012
4.597
-0.191
-3.99%
jan 1, 2013
4.555
-0.042
-0.9%
Ranking of countries by current statistics by years


Comments: