29
/
en
AIzaSyAYiBZKx7MnpbEhh9jyipgxe19OcubqV5w
April 1, 2024
261373
Tanzania
TZA
true
2
1
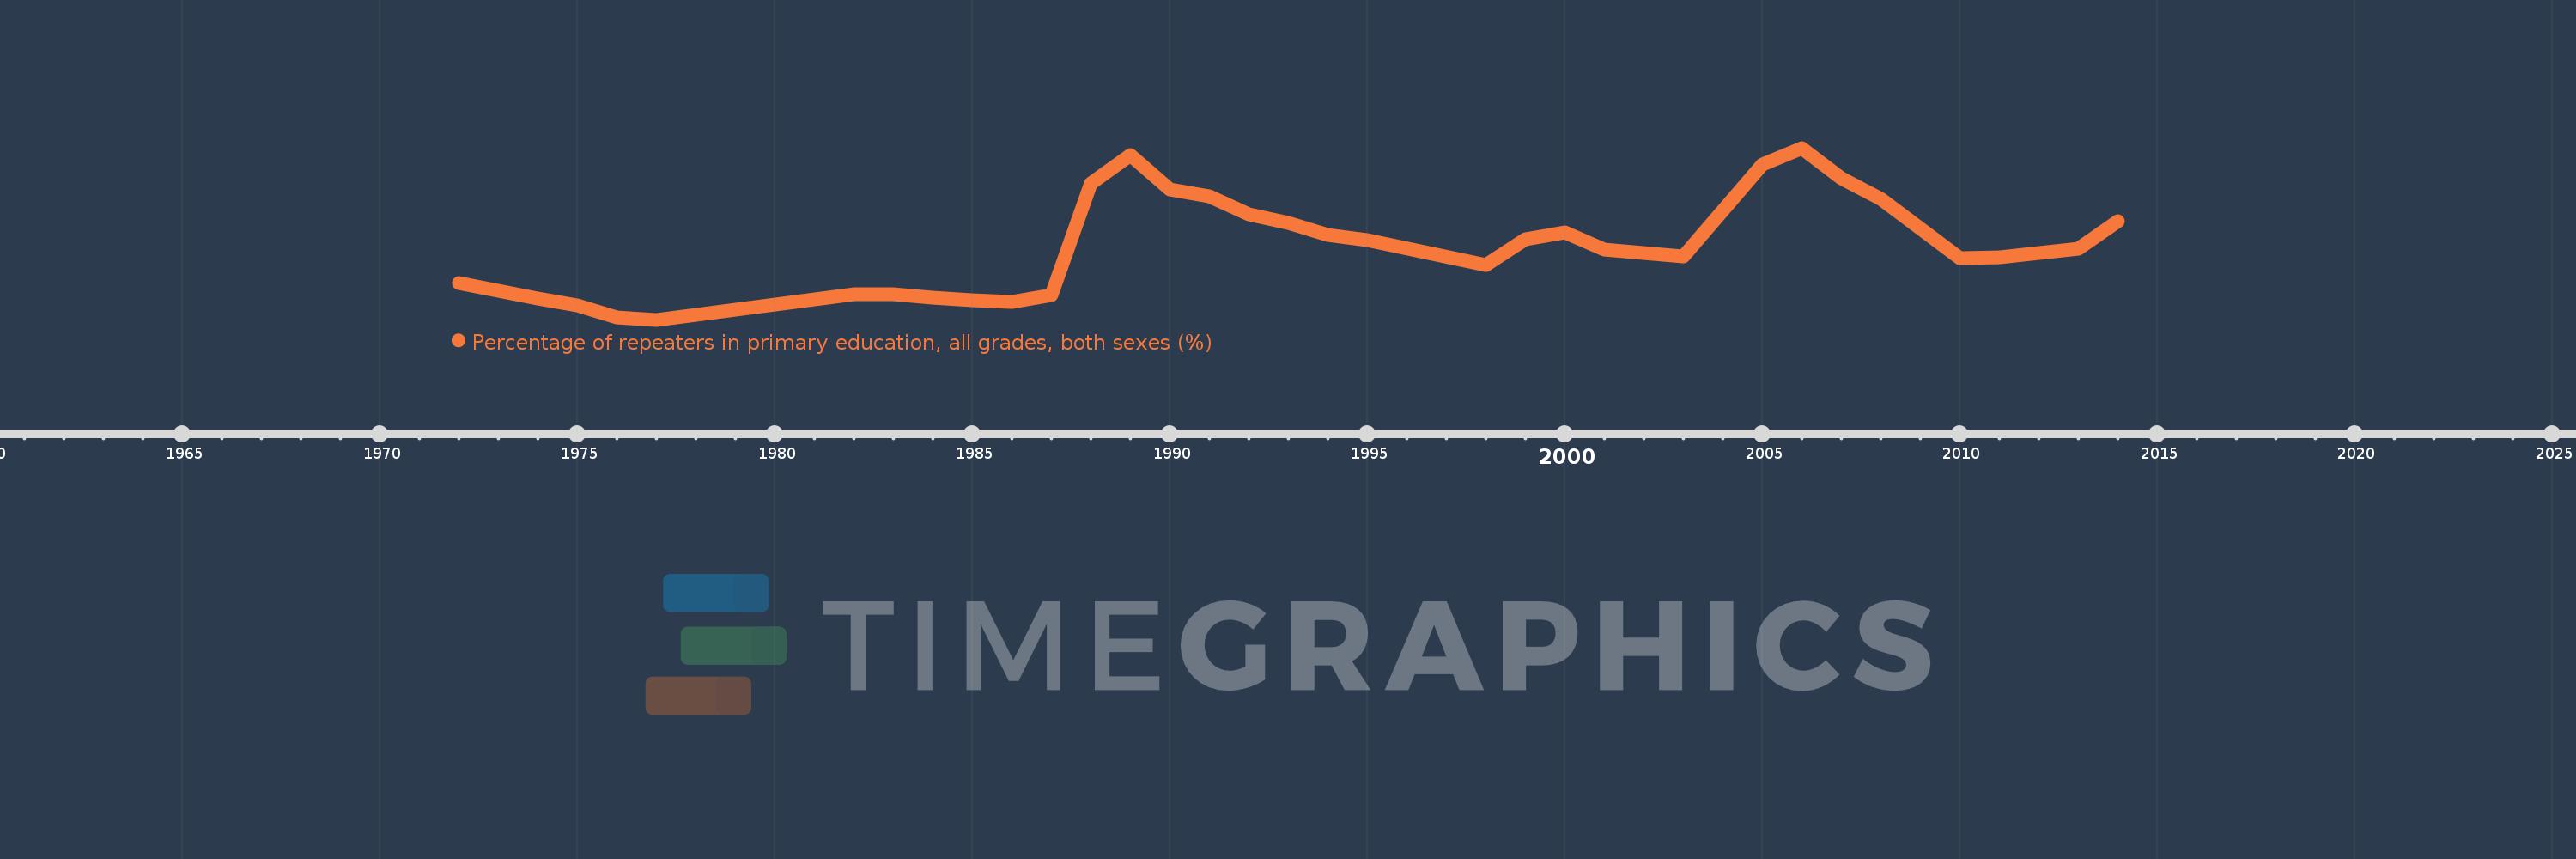
Percentage of repeaters in primary education, all grades, both sexes (%)
2014,2013,2011,2010,2008,2007,2006,2005,2003,2002,2001,2000,1999,1998,1995,1994,1993,1992,1991,1990,1989,1988,1987,1986,1985,1984,1983,1982,1977,1976,1975,1974,1973,1972
This statistics in other country:
AfghanistanAlbaniaAlgeriaAndorraAngolaAntigua and BarbudaArab WorldArgentinaArmeniaArubaAustriaAzerbaijanBahamas, TheBahrainBangladeshBelarusBelgiumBelizeBeninBermudaBhutanBoliviaBosnia and HerzegovinaBotswanaBrazilBritish Virgin IslandsBrunei DarussalamBulgariaBurkina FasoBurundiCabo VerdeCambodiaCameroonCanadaCaribbean small statesCayman IslandsCentral African RepublicCentral Europe and the BalticsChadChileChinaColombiaComorosCongo, Dem. Rep.Congo, Rep.Costa RicaCote d'IvoireCroatiaCubaCyprusCzech RepublicDenmarkDjiboutiDominicaDominican RepublicEarly-demographic dividendEast Asia & PacificEast Asia & Pacific (excluding high income)East Asia & Pacific (IDA & IBRD countries)EcuadorEgypt, Arab Rep.El SalvadorEquatorial GuineaEritreaEstoniaEthiopiaEuro areaEurope & Central AsiaEurope & Central Asia (excluding high income)Europe & Central Asia (IDA & IBRD countries)European UnionFijiFinlandFragile and conflict affected situationsFranceGabonGambia, TheGeorgiaGermanyGhanaGreeceGrenadaGuatemalaGuineaGuinea-BissauGuyanaHaitiHeavily indebted poor countries (HIPC)High incomeHondurasHong Kong SAR, ChinaHungaryIBRD onlyIcelandIDA & IBRD totalIDA blendIDA onlyIDA totalIndiaIndonesiaIran, Islamic Rep.IraqIrelandIsraelItalyJamaicaJapanJordanKazakhstanKenyaKiribatiKorea, Rep.KuwaitKyrgyz RepublicLao PDRLate-demographic dividendLatin America & Caribbean Latin America & Caribbean (excluding high income)Latin America & the Caribbean (IDA & IBRD countries)LatviaLeast developed countries: UN classificationLebanonLesothoLiberiaLibyaLiechtensteinLithuaniaLow & middle incomeLow incomeLower middle incomeLuxembourgMacao SAR, ChinaMacedonia, FYRMadagascarMalawiMalaysiaMaldivesMaliMaltaMauritaniaMauritiusMexicoMiddle East & North AfricaMiddle East & North Africa (excluding high income)Middle East & North Africa (IDA & IBRD countries)Middle incomeMoldovaMonacoMongoliaMontenegroMoroccoMozambiqueMyanmarNamibiaNauruNepalNetherlandsNew ZealandNicaraguaNigerNorwayOECD membersOmanOther small statesPacific island small statesPakistanPalauPanamaPapua New GuineaParaguayPeruPhilippinesPolandPortugalPost-demographic dividendPre-demographic dividendQatarRomaniaRussian FederationRwandaSamoaSan MarinoSao Tome and PrincipeSaudi ArabiaSenegalSerbiaSeychellesSierra LeoneSingaporeSint Maarten (Dutch part)Slovak RepublicSloveniaSmall statesSolomon IslandsSomaliaSouth AfricaSouth AsiaSouth Asia (IDA & IBRD)South SudanSpainSri LankaSt. Kitts and NevisSt. LuciaSt. Vincent and the GrenadinesSub-Saharan Africa Sub-Saharan Africa (excluding high income)Sub-Saharan Africa (IDA & IBRD countries)SudanSurinameSwazilandSwedenSwitzerlandSyrian Arab RepublicTajikistanTanzaniaThailandTimor-LesteTogoTongaTrinidad and TobagoTunisiaTurkeyTurks and Caicos IslandsTuvaluUgandaUkraineUnited Arab EmiratesUnited KingdomUpper middle incomeUruguayUzbekistanVanuatuVenezuela, RBVietnamWest Bank and GazaWorldYemen, Rep.ZambiaZimbabwe Timeline:
This timeline shows a graph from 1972 to 2014 of Tanzania. No data until 1971. Number of actual observations by date: 34.
Source name:
World Development Indicators
Source organization:
UNESCO Institute for Statistics
Categories, topics:
Education
Last updated:
apr 23, 2017
Indicators value changes by year
At the date of observation
Value
Absolute change
Change from previous value
jan 1, 1972
1.575
+1.575
0.0%
jan 1, 1973
1.314
-0.26
-16.54%
jan 1, 1974
1.091
-0.224
-17.02%
jan 1, 1975
0.858
-0.233
-21.34%
jan 1, 1976
0.488
-0.37
-43.17%
jan 1, 1977
0.41
-0.078
-15.98%
jan 1, 1982
1.221
+0.812
198.21%
jan 1, 1983
1.222
+0.001
0.05%
jan 1, 1984
1.119
-0.103
-8.43%
jan 1, 1985
1.013
-0.106
-9.47%
jan 1, 1986
0.97
-0.044
-4.3%
jan 1, 1987
1.186
+0.217
22.37%
jan 1, 1988
4.707
+3.521
296.77%
jan 1, 1989
5.607
+0.9
19.12%
jan 1, 1990
4.51
-1.098
-19.58%
jan 1, 1991
4.313
-0.196
-4.35%
jan 1, 1992
3.719
-0.594
-13.78%
jan 1, 1993
3.449
-0.27
-7.25%
jan 1, 1994
3.083
-0.367
-10.63%
jan 1, 1995
2.932
-0.151
-4.88%
jan 1, 1998
2.146
-0.786
-26.81%
jan 1, 1999
2.946
+0.8
37.28%
jan 1, 2000
3.162
+0.216
7.34%
jan 1, 2001
2.623
-0.54
-17.07%
jan 1, 2002
2.524
-0.099
-3.77%
jan 1, 2003
2.408
-0.115
-4.57%
jan 1, 2005
5.304
+2.896
120.23%
jan 1, 2006
5.825
+0.521
9.83%
jan 1, 2007
4.878
-0.947
-16.25%
jan 1, 2008
4.22
-0.658
-13.49%
jan 1, 2010
2.355
-1.865
-44.19%
jan 1, 2011
2.391
+0.036
1.53%
jan 1, 2013
2.645
+0.253
10.59%
jan 1, 2014
3.504
+0.859
32.47%
Ranking of countries by current statistics by years


Comments: