29
/
en
AIzaSyAYiBZKx7MnpbEhh9jyipgxe19OcubqV5w
April 1, 2024
165306
Jordan
JOR
true
2
1
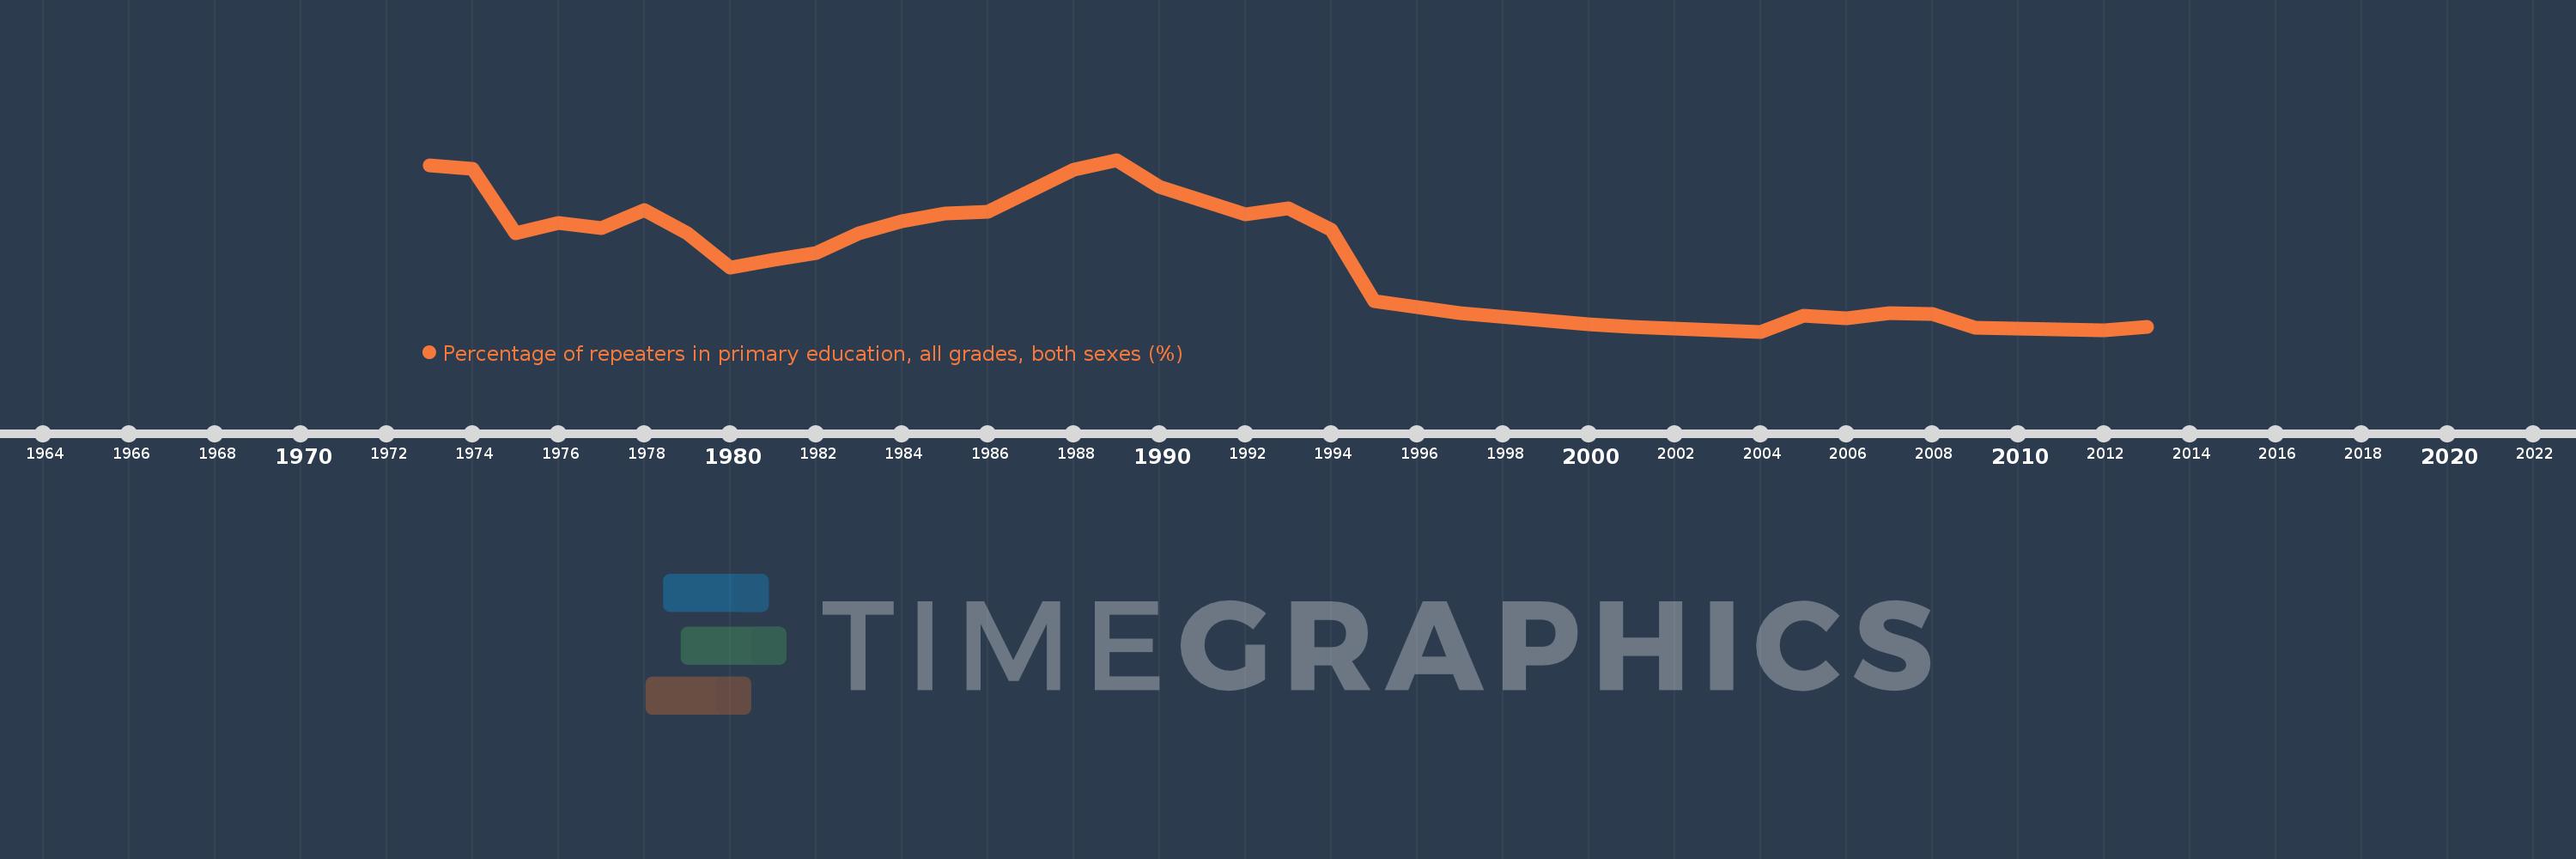
Percentage of repeaters in primary education, all grades, both sexes (%)
2013,2012,2009,2008,2007,2006,2005,2004,2003,2001,2000,1997,1995,1994,1993,1992,1991,1990,1989,1988,1986,1985,1984,1983,1982,1981,1980,1979,1978,1977,1976,1975,1974,1973
This statistics in other country:
AfghanistanAlbaniaAlgeriaAndorraAngolaAntigua and BarbudaArab WorldArgentinaArmeniaArubaAustriaAzerbaijanBahamas, TheBahrainBangladeshBelarusBelgiumBelizeBeninBermudaBhutanBoliviaBosnia and HerzegovinaBotswanaBrazilBritish Virgin IslandsBrunei DarussalamBulgariaBurkina FasoBurundiCabo VerdeCambodiaCameroonCanadaCaribbean small statesCayman IslandsCentral African RepublicCentral Europe and the BalticsChadChileChinaColombiaComorosCongo, Dem. Rep.Congo, Rep.Costa RicaCote d'IvoireCroatiaCubaCyprusCzech RepublicDenmarkDjiboutiDominicaDominican RepublicEarly-demographic dividendEast Asia & PacificEast Asia & Pacific (excluding high income)East Asia & Pacific (IDA & IBRD countries)EcuadorEgypt, Arab Rep.El SalvadorEquatorial GuineaEritreaEstoniaEthiopiaEuro areaEurope & Central AsiaEurope & Central Asia (excluding high income)Europe & Central Asia (IDA & IBRD countries)European UnionFijiFinlandFragile and conflict affected situationsFranceGabonGambia, TheGeorgiaGermanyGhanaGreeceGrenadaGuatemalaGuineaGuinea-BissauGuyanaHaitiHeavily indebted poor countries (HIPC)High incomeHondurasHong Kong SAR, ChinaHungaryIBRD onlyIcelandIDA & IBRD totalIDA blendIDA onlyIDA totalIndiaIndonesiaIran, Islamic Rep.IraqIrelandIsraelItalyJamaicaJapanJordanKazakhstanKenyaKiribatiKorea, Rep.KuwaitKyrgyz RepublicLao PDRLate-demographic dividendLatin America & Caribbean Latin America & Caribbean (excluding high income)Latin America & the Caribbean (IDA & IBRD countries)LatviaLeast developed countries: UN classificationLebanonLesothoLiberiaLibyaLiechtensteinLithuaniaLow & middle incomeLow incomeLower middle incomeLuxembourgMacao SAR, ChinaMacedonia, FYRMadagascarMalawiMalaysiaMaldivesMaliMaltaMauritaniaMauritiusMexicoMiddle East & North AfricaMiddle East & North Africa (excluding high income)Middle East & North Africa (IDA & IBRD countries)Middle incomeMoldovaMonacoMongoliaMontenegroMoroccoMozambiqueMyanmarNamibiaNauruNepalNetherlandsNew ZealandNicaraguaNigerNorwayOECD membersOmanOther small statesPacific island small statesPakistanPalauPanamaPapua New GuineaParaguayPeruPhilippinesPolandPortugalPost-demographic dividendPre-demographic dividendQatarRomaniaRussian FederationRwandaSamoaSan MarinoSao Tome and PrincipeSaudi ArabiaSenegalSerbiaSeychellesSierra LeoneSingaporeSint Maarten (Dutch part)Slovak RepublicSloveniaSmall statesSolomon IslandsSomaliaSouth AfricaSouth AsiaSouth Asia (IDA & IBRD)South SudanSpainSri LankaSt. Kitts and NevisSt. LuciaSt. Vincent and the GrenadinesSub-Saharan Africa Sub-Saharan Africa (excluding high income)Sub-Saharan Africa (IDA & IBRD countries)SudanSurinameSwazilandSwedenSwitzerlandSyrian Arab RepublicTajikistanTanzaniaThailandTimor-LesteTogoTongaTrinidad and TobagoTunisiaTurkeyTurks and Caicos IslandsTuvaluUgandaUkraineUnited Arab EmiratesUnited KingdomUpper middle incomeUruguayUzbekistanVanuatuVenezuela, RBVietnamWest Bank and GazaWorldYemen, Rep.ZambiaZimbabwe Timeline:
This timeline shows a graph from 1973 to 2013 of Jordan. No data until 1972. Number of actual observations by date: 34.
Source name:
World Development Indicators
Source organization:
UNESCO Institute for Statistics
Categories, topics:
Education
Last updated:
apr 23, 2017
Indicators value changes by year
At the date of observation
Value
Absolute change
Change from previous value
jan 1, 1973
6.353
+6.353
0.0%
jan 1, 1974
6.218
-0.135
-2.12%
jan 1, 1975
3.941
-2.278
-36.63%
jan 1, 1976
4.313
+0.372
9.44%
jan 1, 1977
4.117
-0.196
-4.54%
jan 1, 1978
4.762
+0.645
15.67%
jan 1, 1979
3.927
-0.835
-17.54%
jan 1, 1980
2.712
-1.215
-30.93%
jan 1, 1981
2.987
+0.274
10.12%
jan 1, 1982
3.231
+0.244
8.17%
jan 1, 1983
3.955
+0.724
22.42%
jan 1, 1984
4.378
+0.423
10.69%
jan 1, 1985
4.638
+0.26
5.95%
jan 1, 1986
4.712
+0.074
1.6%
jan 1, 1988
6.19
+1.478
31.36%
jan 1, 1989
6.54
+0.35
5.65%
jan 1, 1990
5.593
-0.947
-14.48%
jan 1, 1991
5.086
-0.507
-9.07%
jan 1, 1992
4.6
-0.485
-9.54%
jan 1, 1993
4.811
+0.21
4.57%
jan 1, 1994
4.074
-0.736
-15.3%
jan 1, 1995
1.536
-2.539
-62.31%
jan 1, 1997
1.126
-0.41
-26.71%
jan 1, 2000
0.713
-0.413
-36.7%
jan 1, 2001
0.641
-0.072
-10.07%
jan 1, 2003
0.5
-0.141
-22.0%
jan 1, 2004
0.461
-0.039
-7.74%
jan 1, 2005
1.014
+0.552
119.8%
jan 1, 2006
0.919
-0.094
-9.29%
jan 1, 2007
1.122
+0.203
22.04%
jan 1, 2008
1.081
-0.041
-3.65%
jan 1, 2009
0.585
-0.496
-45.86%
jan 1, 2012
0.499
-0.086
-14.74%
jan 1, 2013
0.617
+0.118
23.74%
Ranking of countries by current statistics by years


Comments: