29
/
en
AIzaSyAYiBZKx7MnpbEhh9jyipgxe19OcubqV5w
April 1, 2024
24415
Arab World
ARB
false
2
1
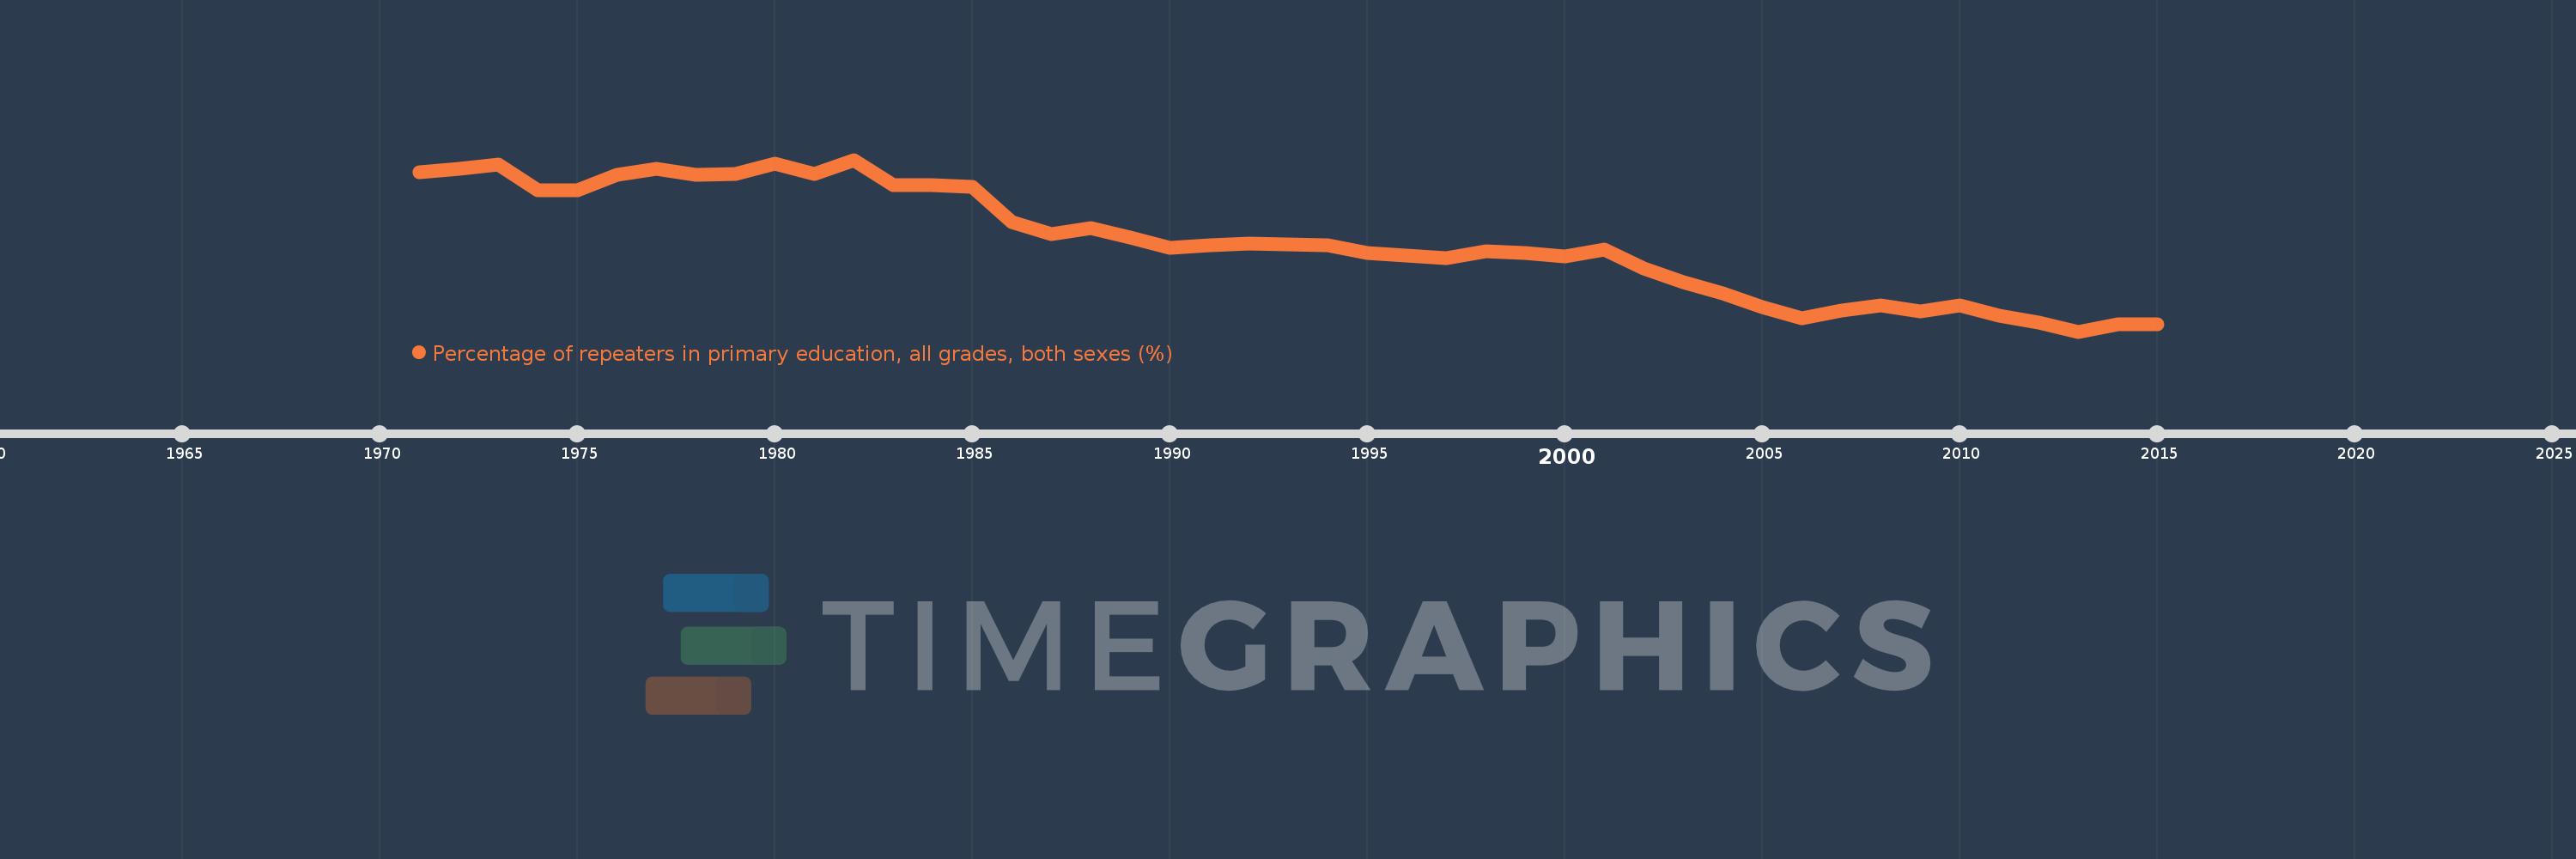
Percentage of repeaters in primary education, all grades, both sexes (%)
2015,2014,2013,2012,2011,2010,2009,2008,2007,2006,2005,2004,2003,2002,2001,2000,1999,1998,1997,1996,1995,1994,1993,1992,1991,1990,1989,1988,1987,1986,1985,1984,1983,1982,1981,1980,1979,1978,1977,1976,1975,1974,1973,1972,1971
This statistics in other country:
AfghanistanAlbaniaAlgeriaAndorraAngolaAntigua and BarbudaArab WorldArgentinaArmeniaArubaAustriaAzerbaijanBahamas, TheBahrainBangladeshBelarusBelgiumBelizeBeninBermudaBhutanBoliviaBosnia and HerzegovinaBotswanaBrazilBritish Virgin IslandsBrunei DarussalamBulgariaBurkina FasoBurundiCabo VerdeCambodiaCameroonCanadaCaribbean small statesCayman IslandsCentral African RepublicCentral Europe and the BalticsChadChileChinaColombiaComorosCongo, Dem. Rep.Congo, Rep.Costa RicaCote d'IvoireCroatiaCubaCyprusCzech RepublicDenmarkDjiboutiDominicaDominican RepublicEarly-demographic dividendEast Asia & PacificEast Asia & Pacific (excluding high income)East Asia & Pacific (IDA & IBRD countries)EcuadorEgypt, Arab Rep.El SalvadorEquatorial GuineaEritreaEstoniaEthiopiaEuro areaEurope & Central AsiaEurope & Central Asia (excluding high income)Europe & Central Asia (IDA & IBRD countries)European UnionFijiFinlandFragile and conflict affected situationsFranceGabonGambia, TheGeorgiaGermanyGhanaGreeceGrenadaGuatemalaGuineaGuinea-BissauGuyanaHaitiHeavily indebted poor countries (HIPC)High incomeHondurasHong Kong SAR, ChinaHungaryIBRD onlyIcelandIDA & IBRD totalIDA blendIDA onlyIDA totalIndiaIndonesiaIran, Islamic Rep.IraqIrelandIsraelItalyJamaicaJapanJordanKazakhstanKenyaKiribatiKorea, Rep.KuwaitKyrgyz RepublicLao PDRLate-demographic dividendLatin America & Caribbean Latin America & Caribbean (excluding high income)Latin America & the Caribbean (IDA & IBRD countries)LatviaLeast developed countries: UN classificationLebanonLesothoLiberiaLibyaLiechtensteinLithuaniaLow & middle incomeLow incomeLower middle incomeLuxembourgMacao SAR, ChinaMacedonia, FYRMadagascarMalawiMalaysiaMaldivesMaliMaltaMauritaniaMauritiusMexicoMiddle East & North AfricaMiddle East & North Africa (excluding high income)Middle East & North Africa (IDA & IBRD countries)Middle incomeMoldovaMonacoMongoliaMontenegroMoroccoMozambiqueMyanmarNamibiaNauruNepalNetherlandsNew ZealandNicaraguaNigerNorwayOECD membersOmanOther small statesPacific island small statesPakistanPalauPanamaPapua New GuineaParaguayPeruPhilippinesPolandPortugalPost-demographic dividendPre-demographic dividendQatarRomaniaRussian FederationRwandaSamoaSan MarinoSao Tome and PrincipeSaudi ArabiaSenegalSerbiaSeychellesSierra LeoneSingaporeSint Maarten (Dutch part)Slovak RepublicSloveniaSmall statesSolomon IslandsSomaliaSouth AfricaSouth AsiaSouth Asia (IDA & IBRD)South SudanSpainSri LankaSt. Kitts and NevisSt. LuciaSt. Vincent and the GrenadinesSub-Saharan Africa Sub-Saharan Africa (excluding high income)Sub-Saharan Africa (IDA & IBRD countries)SudanSurinameSwazilandSwedenSwitzerlandSyrian Arab RepublicTajikistanTanzaniaThailandTimor-LesteTogoTongaTrinidad and TobagoTunisiaTurkeyTurks and Caicos IslandsTuvaluUgandaUkraineUnited Arab EmiratesUnited KingdomUpper middle incomeUruguayUzbekistanVanuatuVenezuela, RBVietnamWest Bank and GazaWorldYemen, Rep.ZambiaZimbabwe Timeline:
This timeline shows a graph from 1971 to 2015 of Arab World. No data until 1970. Number of actual observations by date: 45.
Source name:
World Development Indicators
Source organization:
UNESCO Institute for Statistics
Categories, topics:
Education
Last updated:
apr 23, 2017
Indicators value changes by year
Maximum:
11.889
jan 1, 1982
At the date of observation
Value
Absolute change
Change from previous value
jan 1, 1971
11.475
+11.475
0.0%
jan 1, 1972
11.578
+0.103
0.9%
jan 1, 1973
11.746
+0.168
1.45%
jan 1, 1974
10.885
-0.861
-7.33%
jan 1, 1975
10.875
-0.01
-0.09%
jan 1, 1976
11.399
+0.523
4.81%
jan 1, 1977
11.584
+0.185
1.62%
jan 1, 1978
11.403
-0.18
-1.56%
jan 1, 1979
11.417
+0.014
0.12%
jan 1, 1980
11.764
+0.347
3.04%
jan 1, 1981
11.41
-0.354
-3.01%
jan 1, 1982
11.889
+0.479
4.2%
jan 1, 1983
11.052
-0.837
-7.04%
jan 1, 1984
11.034
-0.018
-0.17%
jan 1, 1985
10.978
-0.056
-0.51%
jan 1, 1986
9.826
-1.152
-10.49%
jan 1, 1987
9.415
-0.411
-4.18%
jan 1, 1988
9.621
+0.206
2.19%
jan 1, 1989
9.3
-0.321
-3.34%
jan 1, 1990
8.965
-0.335
-3.6%
jan 1, 1991
9.044
+0.078
0.87%
jan 1, 1992
9.1
+0.057
0.63%
jan 1, 1993
9.072
-0.029
-0.31%
jan 1, 1994
9.037
-0.035
-0.38%
jan 1, 1995
8.8
-0.237
-2.63%
jan 1, 1996
8.712
-0.088
-1.0%
jan 1, 1997
8.621
-0.09
-1.04%
jan 1, 1998
8.841
+0.22
2.55%
jan 1, 1999
8.774
-0.068
-0.77%
jan 1, 2000
8.66
-0.113
-1.29%
jan 1, 2001
8.906
+0.246
2.84%
jan 1, 2002
8.279
-0.627
-7.04%
jan 1, 2003
7.812
-0.467
-5.64%
jan 1, 2004
7.445
-0.367
-4.69%
jan 1, 2005
7.0
-0.446
-5.98%
jan 1, 2006
6.629
-0.371
-5.3%
jan 1, 2007
6.872
+0.244
3.67%
jan 1, 2008
7.053
+0.181
2.64%
jan 1, 2009
6.836
-0.218
-3.09%
jan 1, 2010
7.034
+0.199
2.91%
jan 1, 2011
6.71
-0.325
-4.62%
jan 1, 2012
6.466
-0.244
-3.63%
jan 1, 2013
6.173
-0.293
-4.53%
jan 1, 2014
6.402
+0.229
3.71%
jan 1, 2015
6.424
+0.022
0.34%
Ranking of countries by current statistics by years


Comments: