30
/
AIzaSyAYiBZKx7MnpbEhh9jyipgxe19OcubqV5w
April 1, 2024
106406
China
CHN
true
2
1
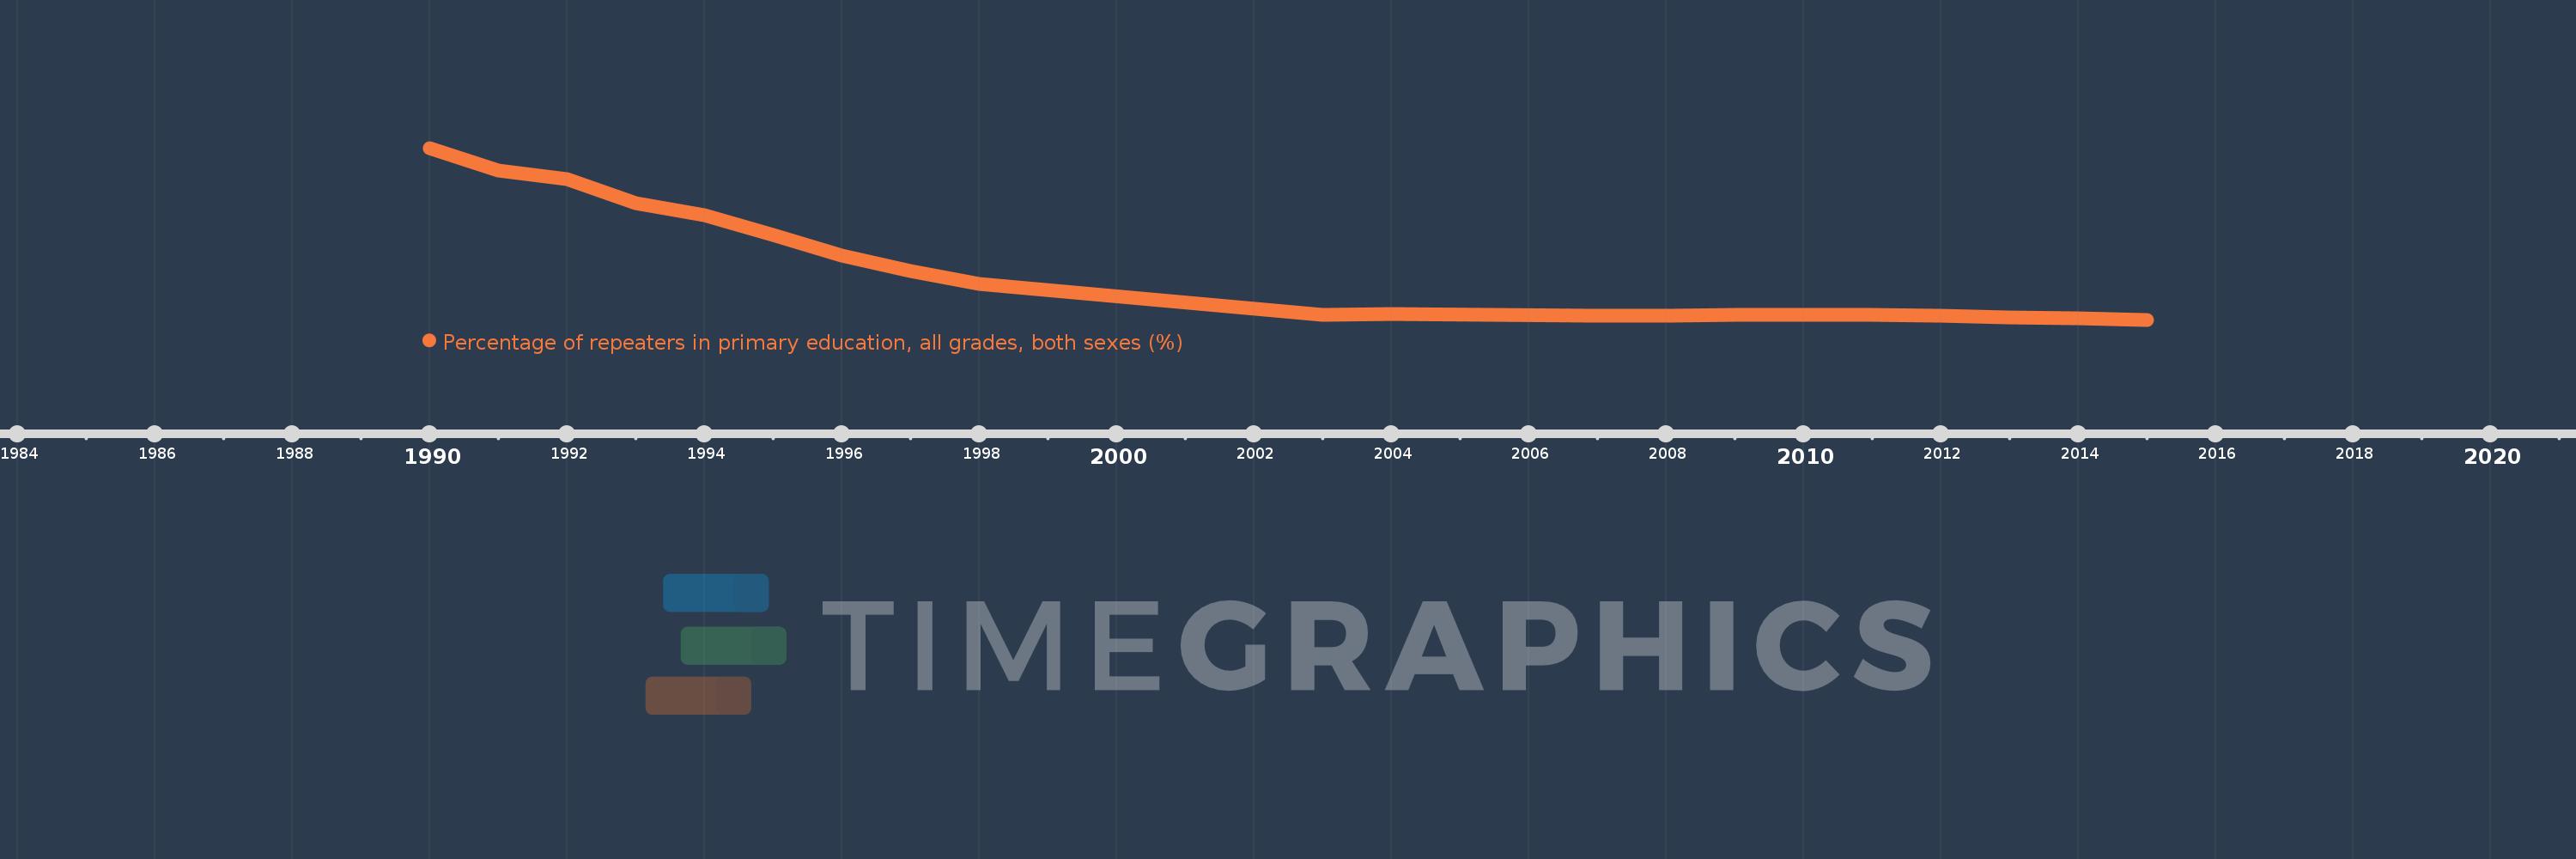
Percentage of repeaters in primary education, all grades, both sexes (%)
2015,2014,2013,2012,2011,2010,2009,2008,2007,2004,2003,1998,1997,1996,1995,1994,1993,1992,1991,1990
