29
/
en
AIzaSyAYiBZKx7MnpbEhh9jyipgxe19OcubqV5w
April 1, 2024
190695
Mali
MLI
true
2
1
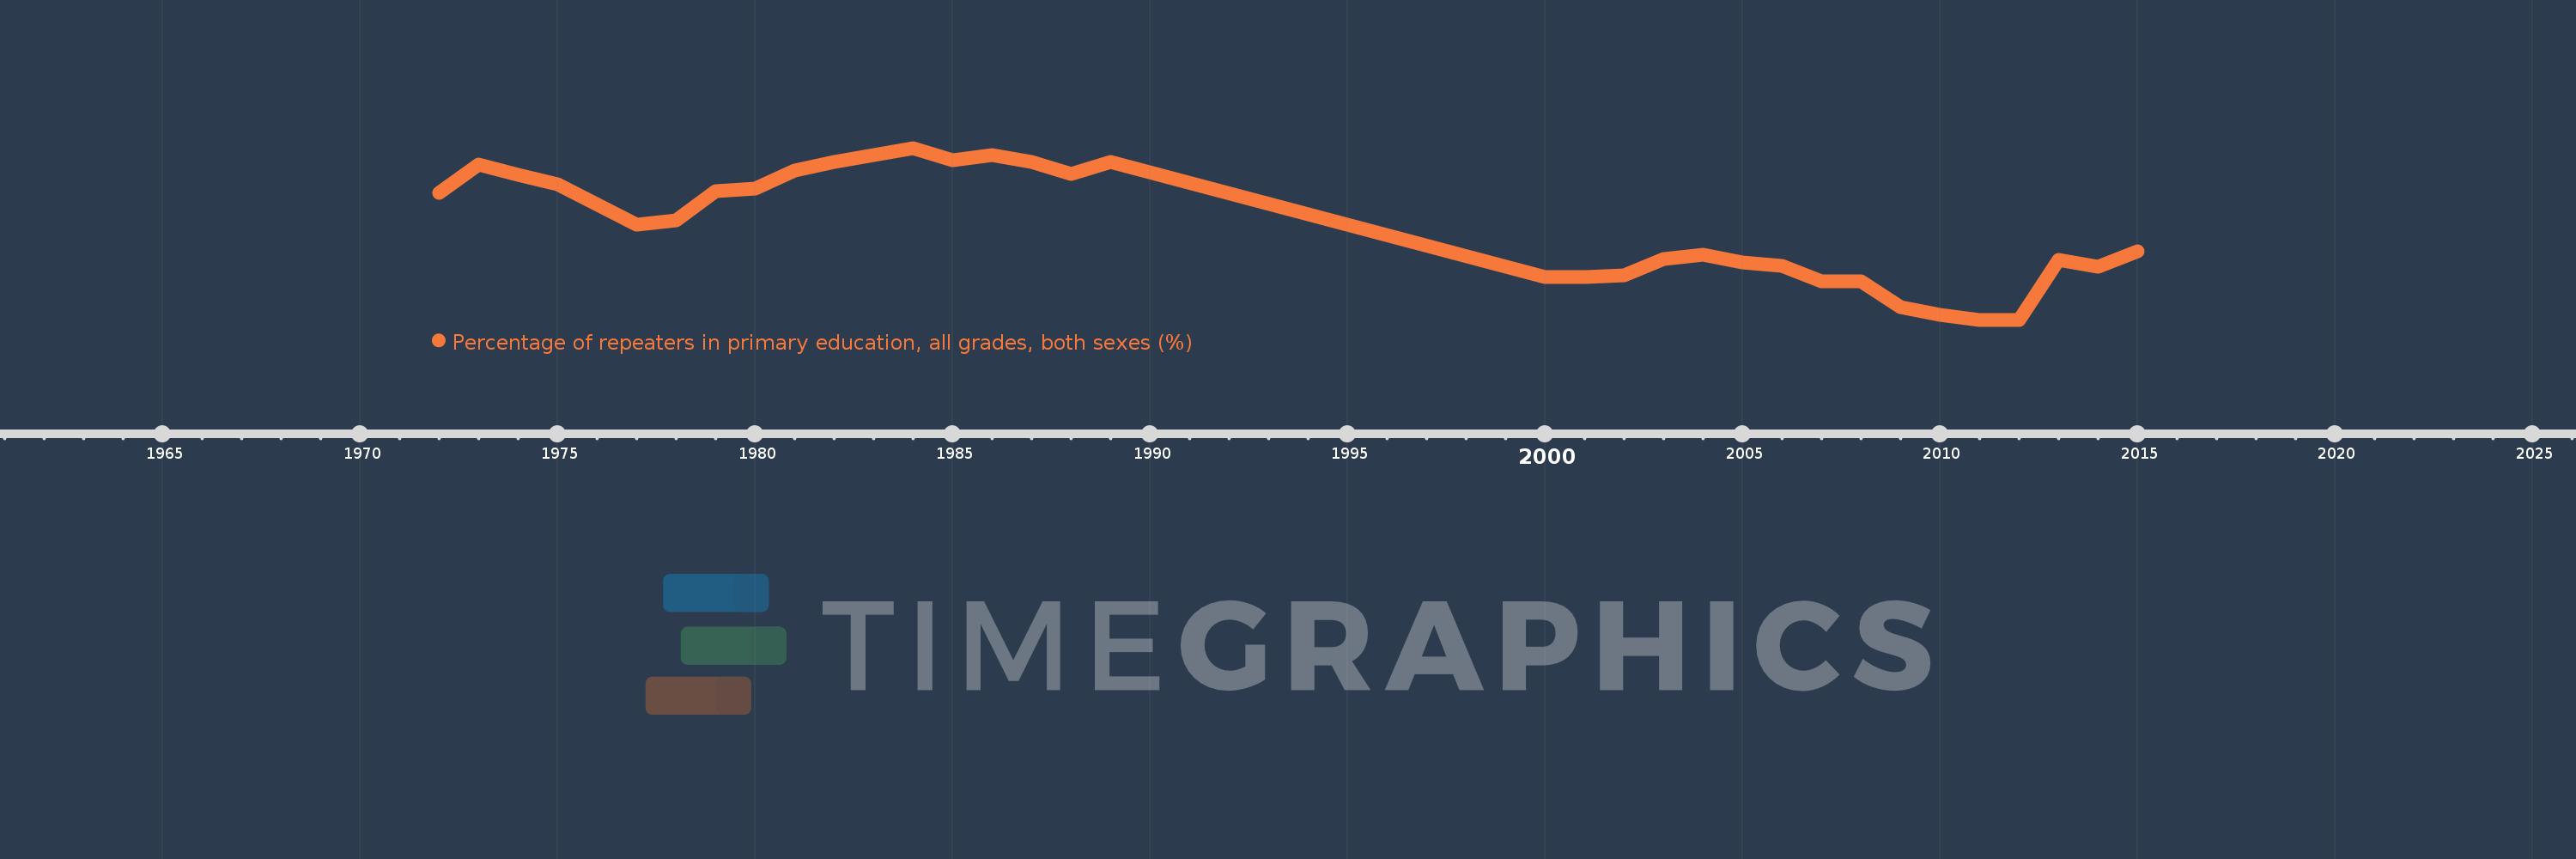
Percentage of repeaters in primary education, all grades, both sexes (%)
2015,2014,2013,2012,2011,2010,2009,2008,2007,2006,2005,2004,2003,2002,2001,2000,1989,1988,1987,1986,1985,1984,1982,1981,1980,1979,1978,1977,1975,1974,1973,1972
This statistics in other country:
AfghanistanAlbaniaAlgeriaAndorraAngolaAntigua and BarbudaArab WorldArgentinaArmeniaArubaAustriaAzerbaijanBahamas, TheBahrainBangladeshBelarusBelgiumBelizeBeninBermudaBhutanBoliviaBosnia and HerzegovinaBotswanaBrazilBritish Virgin IslandsBrunei DarussalamBulgariaBurkina FasoBurundiCabo VerdeCambodiaCameroonCanadaCaribbean small statesCayman IslandsCentral African RepublicCentral Europe and the BalticsChadChileChinaColombiaComorosCongo, Dem. Rep.Congo, Rep.Costa RicaCote d'IvoireCroatiaCubaCyprusCzech RepublicDenmarkDjiboutiDominicaDominican RepublicEarly-demographic dividendEast Asia & PacificEast Asia & Pacific (excluding high income)East Asia & Pacific (IDA & IBRD countries)EcuadorEgypt, Arab Rep.El SalvadorEquatorial GuineaEritreaEstoniaEthiopiaEuro areaEurope & Central AsiaEurope & Central Asia (excluding high income)Europe & Central Asia (IDA & IBRD countries)European UnionFijiFinlandFragile and conflict affected situationsFranceGabonGambia, TheGeorgiaGermanyGhanaGreeceGrenadaGuatemalaGuineaGuinea-BissauGuyanaHaitiHeavily indebted poor countries (HIPC)High incomeHondurasHong Kong SAR, ChinaHungaryIBRD onlyIcelandIDA & IBRD totalIDA blendIDA onlyIDA totalIndiaIndonesiaIran, Islamic Rep.IraqIrelandIsraelItalyJamaicaJapanJordanKazakhstanKenyaKiribatiKorea, Rep.KuwaitKyrgyz RepublicLao PDRLate-demographic dividendLatin America & Caribbean Latin America & Caribbean (excluding high income)Latin America & the Caribbean (IDA & IBRD countries)LatviaLeast developed countries: UN classificationLebanonLesothoLiberiaLibyaLiechtensteinLithuaniaLow & middle incomeLow incomeLower middle incomeLuxembourgMacao SAR, ChinaMacedonia, FYRMadagascarMalawiMalaysiaMaldivesMaliMaltaMauritaniaMauritiusMexicoMiddle East & North AfricaMiddle East & North Africa (excluding high income)Middle East & North Africa (IDA & IBRD countries)Middle incomeMoldovaMonacoMongoliaMontenegroMoroccoMozambiqueMyanmarNamibiaNauruNepalNetherlandsNew ZealandNicaraguaNigerNorwayOECD membersOmanOther small statesPacific island small statesPakistanPalauPanamaPapua New GuineaParaguayPeruPhilippinesPolandPortugalPost-demographic dividendPre-demographic dividendQatarRomaniaRussian FederationRwandaSamoaSan MarinoSao Tome and PrincipeSaudi ArabiaSenegalSerbiaSeychellesSierra LeoneSingaporeSint Maarten (Dutch part)Slovak RepublicSloveniaSmall statesSolomon IslandsSomaliaSouth AfricaSouth AsiaSouth Asia (IDA & IBRD)South SudanSpainSri LankaSt. Kitts and NevisSt. LuciaSt. Vincent and the GrenadinesSub-Saharan Africa Sub-Saharan Africa (excluding high income)Sub-Saharan Africa (IDA & IBRD countries)SudanSurinameSwazilandSwedenSwitzerlandSyrian Arab RepublicTajikistanTanzaniaThailandTimor-LesteTogoTongaTrinidad and TobagoTunisiaTurkeyTurks and Caicos IslandsTuvaluUgandaUkraineUnited Arab EmiratesUnited KingdomUpper middle incomeUruguayUzbekistanVanuatuVenezuela, RBVietnamWest Bank and GazaWorldYemen, Rep.ZambiaZimbabwe Timeline:
This timeline shows a graph from 1972 to 2015 of Mali. No data until 1971. Number of actual observations by date: 32.
Source name:
World Development Indicators
Source organization:
UNESCO Institute for Statistics
Categories, topics:
Education
Last updated:
apr 23, 2017
Indicators value changes by year
Minimum:
12.855
jan 1, 2011
At the date of observation
Value
Absolute change
Change from previous value
jan 1, 1972
26.322
+26.322
0.0%
jan 1, 1973
29.245
+2.923
11.1%
jan 1, 1974
28.171
-1.073
-3.67%
jan 1, 1975
27.167
-1.004
-3.56%
jan 1, 1977
22.918
-4.25
-15.64%
jan 1, 1978
23.391
+0.473
2.06%
jan 1, 1979
26.498
+3.108
13.29%
jan 1, 1980
26.726
+0.228
0.86%
jan 1, 1981
28.643
+1.917
7.17%
jan 1, 1982
29.59
+0.947
3.31%
jan 1, 1984
31.03
+1.44
4.87%
jan 1, 1985
29.763
-1.267
-4.08%
jan 1, 1986
30.32
+0.557
1.87%
jan 1, 1987
29.56
-0.76
-2.51%
jan 1, 1988
28.249
-1.311
-4.44%
jan 1, 1989
29.55
+1.301
4.6%
jan 1, 2000
17.408
-12.142
-41.09%
jan 1, 2001
17.408
+0.0
0.0%
jan 1, 2002
17.523
+0.115
0.66%
jan 1, 2003
19.276
+1.753
10.01%
jan 1, 2004
19.765
+0.489
2.54%
jan 1, 2005
18.958
-0.807
-4.08%
jan 1, 2006
18.584
-0.374
-1.97%
jan 1, 2007
16.956
-1.627
-8.76%
jan 1, 2008
16.956
0.0
0.0%
jan 1, 2009
14.221
-2.735
-16.13%
jan 1, 2010
13.389
-0.832
-5.85%
jan 1, 2011
12.855
-0.534
-3.99%
jan 1, 2012
12.855
+0.0
0.0%
jan 1, 2013
19.221
+6.366
49.52%
jan 1, 2014
18.424
-0.797
-4.14%
jan 1, 2015
20.064
+1.64
8.9%
Ranking of countries by current statistics by years


Comments: