29
/
en
AIzaSyAYiBZKx7MnpbEhh9jyipgxe19OcubqV5w
April 1, 2024
161841
Italy
ITA
true
2
1
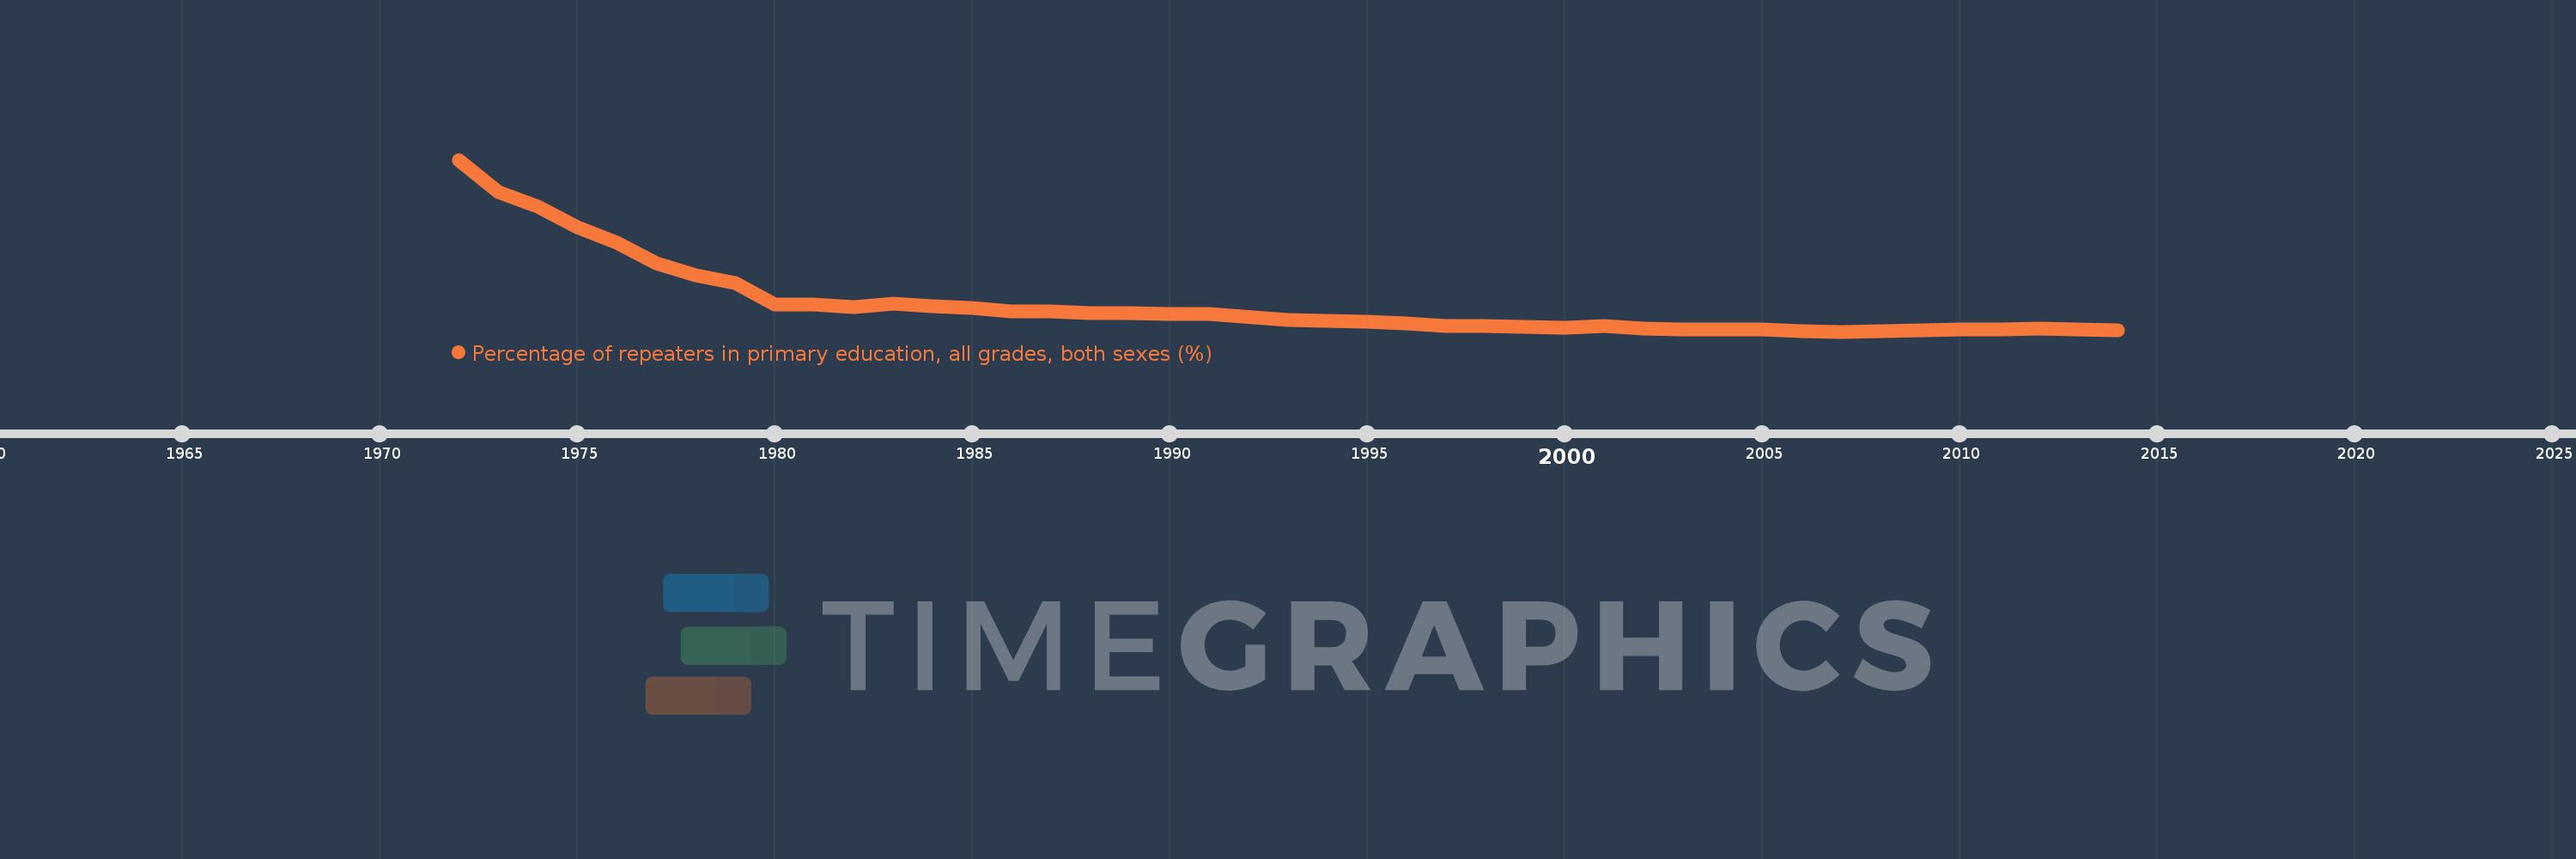
Percentage of repeaters in primary education, all grades, both sexes (%)
2014,2013,2012,2011,2010,2009,2008,2007,2006,2005,2004,2003,2002,2001,2000,1998,1997,1996,1995,1993,1991,1990,1989,1988,1987,1986,1985,1984,1983,1982,1981,1980,1979,1978,1977,1976,1975,1974,1973,1972
This statistics in other country:
AfghanistanAlbaniaAlgeriaAndorraAngolaAntigua and BarbudaArab WorldArgentinaArmeniaArubaAustriaAzerbaijanBahamas, TheBahrainBangladeshBelarusBelgiumBelizeBeninBermudaBhutanBoliviaBosnia and HerzegovinaBotswanaBrazilBritish Virgin IslandsBrunei DarussalamBulgariaBurkina FasoBurundiCabo VerdeCambodiaCameroonCanadaCaribbean small statesCayman IslandsCentral African RepublicCentral Europe and the BalticsChadChileChinaColombiaComorosCongo, Dem. Rep.Congo, Rep.Costa RicaCote d'IvoireCroatiaCubaCyprusCzech RepublicDenmarkDjiboutiDominicaDominican RepublicEarly-demographic dividendEast Asia & PacificEast Asia & Pacific (excluding high income)East Asia & Pacific (IDA & IBRD countries)EcuadorEgypt, Arab Rep.El SalvadorEquatorial GuineaEritreaEstoniaEthiopiaEuro areaEurope & Central AsiaEurope & Central Asia (excluding high income)Europe & Central Asia (IDA & IBRD countries)European UnionFijiFinlandFragile and conflict affected situationsFranceGabonGambia, TheGeorgiaGermanyGhanaGreeceGrenadaGuatemalaGuineaGuinea-BissauGuyanaHaitiHeavily indebted poor countries (HIPC)High incomeHondurasHong Kong SAR, ChinaHungaryIBRD onlyIcelandIDA & IBRD totalIDA blendIDA onlyIDA totalIndiaIndonesiaIran, Islamic Rep.IraqIrelandIsraelItalyJamaicaJapanJordanKazakhstanKenyaKiribatiKorea, Rep.KuwaitKyrgyz RepublicLao PDRLate-demographic dividendLatin America & Caribbean Latin America & Caribbean (excluding high income)Latin America & the Caribbean (IDA & IBRD countries)LatviaLeast developed countries: UN classificationLebanonLesothoLiberiaLibyaLiechtensteinLithuaniaLow & middle incomeLow incomeLower middle incomeLuxembourgMacao SAR, ChinaMacedonia, FYRMadagascarMalawiMalaysiaMaldivesMaliMaltaMauritaniaMauritiusMexicoMiddle East & North AfricaMiddle East & North Africa (excluding high income)Middle East & North Africa (IDA & IBRD countries)Middle incomeMoldovaMonacoMongoliaMontenegroMoroccoMozambiqueMyanmarNamibiaNauruNepalNetherlandsNew ZealandNicaraguaNigerNorwayOECD membersOmanOther small statesPacific island small statesPakistanPalauPanamaPapua New GuineaParaguayPeruPhilippinesPolandPortugalPost-demographic dividendPre-demographic dividendQatarRomaniaRussian FederationRwandaSamoaSan MarinoSao Tome and PrincipeSaudi ArabiaSenegalSerbiaSeychellesSierra LeoneSingaporeSint Maarten (Dutch part)Slovak RepublicSloveniaSmall statesSolomon IslandsSomaliaSouth AfricaSouth AsiaSouth Asia (IDA & IBRD)South SudanSpainSri LankaSt. Kitts and NevisSt. LuciaSt. Vincent and the GrenadinesSub-Saharan Africa Sub-Saharan Africa (excluding high income)Sub-Saharan Africa (IDA & IBRD countries)SudanSurinameSwazilandSwedenSwitzerlandSyrian Arab RepublicTajikistanTanzaniaThailandTimor-LesteTogoTongaTrinidad and TobagoTunisiaTurkeyTurks and Caicos IslandsTuvaluUgandaUkraineUnited Arab EmiratesUnited KingdomUpper middle incomeUruguayUzbekistanVanuatuVenezuela, RBVietnamWest Bank and GazaWorldYemen, Rep.ZambiaZimbabwe Timeline:
This timeline shows a graph from 1972 to 2014 of Italy. No data until 1971. Number of actual observations by date: 40.
Source name:
World Development Indicators
Source organization:
UNESCO Institute for Statistics
Categories, topics:
Education
Last updated:
apr 23, 2017
Indicators value changes by year
At the date of observation
Value
Absolute change
Change from previous value
jan 1, 1972
7.207
+7.207
0.0%
jan 1, 1973
5.879
-1.328
-18.43%
jan 1, 1974
5.29
-0.589
-10.02%
jan 1, 1975
4.462
-0.828
-15.65%
jan 1, 1976
3.848
-0.614
-13.77%
jan 1, 1977
2.977
-0.871
-22.64%
jan 1, 1978
2.507
-0.47
-15.79%
jan 1, 1979
2.204
-0.303
-12.09%
jan 1, 1980
1.312
-0.892
-40.48%
jan 1, 1981
1.318
+0.007
0.5%
jan 1, 1982
1.222
-0.096
-7.32%
jan 1, 1983
1.347
+0.126
10.28%
jan 1, 1984
1.247
-0.1
-7.43%
jan 1, 1985
1.188
-0.059
-4.77%
jan 1, 1986
1.043
-0.145
-12.23%
jan 1, 1987
1.02
-0.022
-2.12%
jan 1, 1988
0.971
-0.05
-4.89%
jan 1, 1989
0.95
-0.021
-2.12%
jan 1, 1990
0.939
-0.011
-1.15%
jan 1, 1991
0.92
-0.019
-2.03%
jan 1, 1993
0.688
-0.232
-25.23%
jan 1, 1995
0.602
-0.086
-12.47%
jan 1, 1996
0.545
-0.057
-9.51%
jan 1, 1997
0.434
-0.11
-20.28%
jan 1, 1998
0.439
+0.005
1.09%
jan 1, 2000
0.385
-0.054
-12.33%
jan 1, 2001
0.436
+0.051
13.35%
jan 1, 2002
0.326
-0.111
-25.39%
jan 1, 2003
0.287
-0.038
-11.7%
jan 1, 2004
0.289
+0.002
0.67%
jan 1, 2005
0.298
+0.008
2.89%
jan 1, 2006
0.231
-0.066
-22.29%
jan 1, 2007
0.215
-0.017
-7.22%
jan 1, 2008
0.243
+0.029
13.28%
jan 1, 2009
0.27
+0.026
10.85%
jan 1, 2010
0.308
+0.039
14.29%
jan 1, 2011
0.311
+0.003
0.92%
jan 1, 2012
0.324
+0.013
4.26%
jan 1, 2013
0.294
-0.03
-9.21%
jan 1, 2014
0.26
-0.034
-11.65%
Ranking of countries by current statistics by years


Comments: