29
/
en
AIzaSyAYiBZKx7MnpbEhh9jyipgxe19OcubqV5w
April 1, 2024
144855
Guatemala
GTM
true
2
1
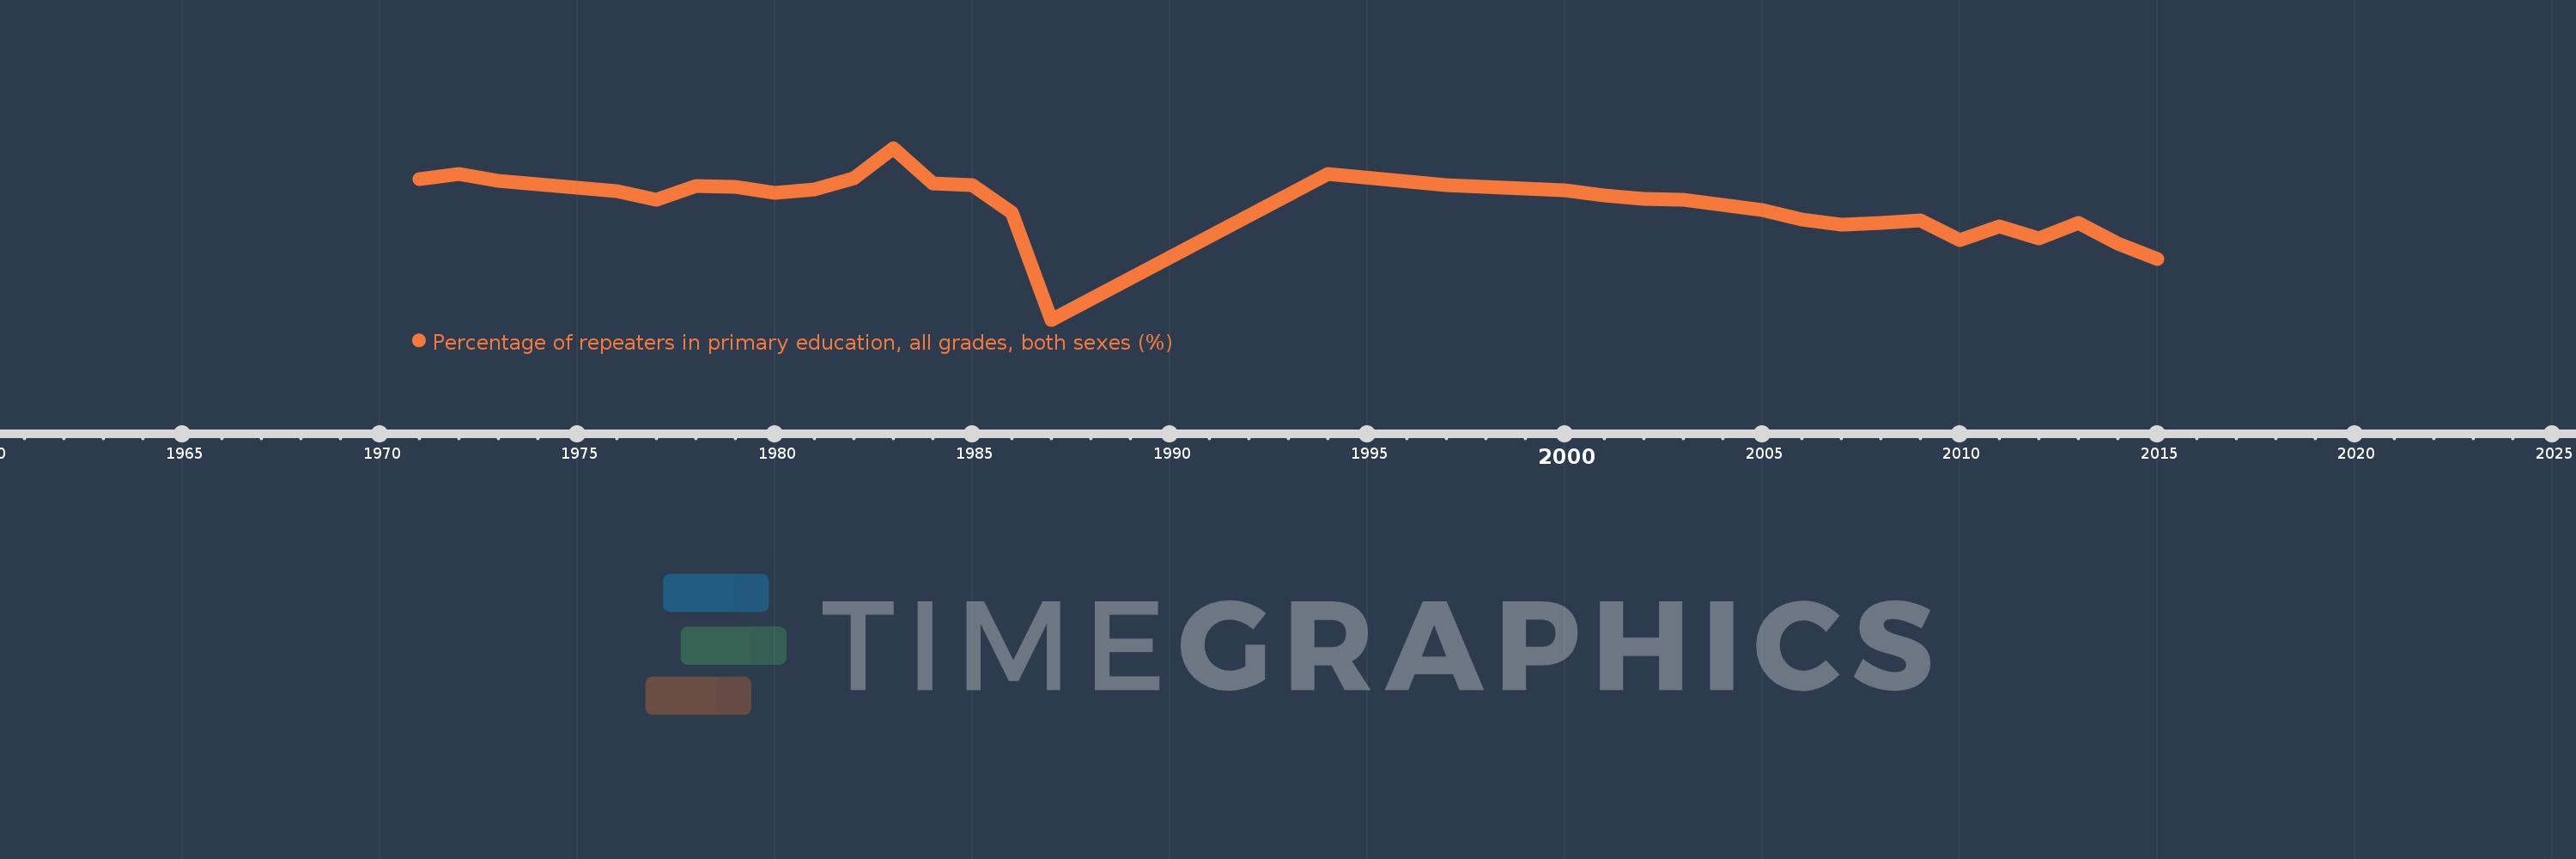
Percentage of repeaters in primary education, all grades, both sexes (%)
2015,2014,2013,2012,2011,2010,2009,2008,2007,2006,2005,2003,2002,2001,2000,1997,1994,1987,1986,1985,1984,1983,1982,1981,1980,1979,1978,1977,1976,1973,1972,1971
This statistics in other country:
AfghanistanAlbaniaAlgeriaAndorraAngolaAntigua and BarbudaArab WorldArgentinaArmeniaArubaAustriaAzerbaijanBahamas, TheBahrainBangladeshBelarusBelgiumBelizeBeninBermudaBhutanBoliviaBosnia and HerzegovinaBotswanaBrazilBritish Virgin IslandsBrunei DarussalamBulgariaBurkina FasoBurundiCabo VerdeCambodiaCameroonCanadaCaribbean small statesCayman IslandsCentral African RepublicCentral Europe and the BalticsChadChileChinaColombiaComorosCongo, Dem. Rep.Congo, Rep.Costa RicaCote d'IvoireCroatiaCubaCyprusCzech RepublicDenmarkDjiboutiDominicaDominican RepublicEarly-demographic dividendEast Asia & PacificEast Asia & Pacific (excluding high income)East Asia & Pacific (IDA & IBRD countries)EcuadorEgypt, Arab Rep.El SalvadorEquatorial GuineaEritreaEstoniaEthiopiaEuro areaEurope & Central AsiaEurope & Central Asia (excluding high income)Europe & Central Asia (IDA & IBRD countries)European UnionFijiFinlandFragile and conflict affected situationsFranceGabonGambia, TheGeorgiaGermanyGhanaGreeceGrenadaGuatemalaGuineaGuinea-BissauGuyanaHaitiHeavily indebted poor countries (HIPC)High incomeHondurasHong Kong SAR, ChinaHungaryIBRD onlyIcelandIDA & IBRD totalIDA blendIDA onlyIDA totalIndiaIndonesiaIran, Islamic Rep.IraqIrelandIsraelItalyJamaicaJapanJordanKazakhstanKenyaKiribatiKorea, Rep.KuwaitKyrgyz RepublicLao PDRLate-demographic dividendLatin America & Caribbean Latin America & Caribbean (excluding high income)Latin America & the Caribbean (IDA & IBRD countries)LatviaLeast developed countries: UN classificationLebanonLesothoLiberiaLibyaLiechtensteinLithuaniaLow & middle incomeLow incomeLower middle incomeLuxembourgMacao SAR, ChinaMacedonia, FYRMadagascarMalawiMalaysiaMaldivesMaliMaltaMauritaniaMauritiusMexicoMiddle East & North AfricaMiddle East & North Africa (excluding high income)Middle East & North Africa (IDA & IBRD countries)Middle incomeMoldovaMonacoMongoliaMontenegroMoroccoMozambiqueMyanmarNamibiaNauruNepalNetherlandsNew ZealandNicaraguaNigerNorwayOECD membersOmanOther small statesPacific island small statesPakistanPalauPanamaPapua New GuineaParaguayPeruPhilippinesPolandPortugalPost-demographic dividendPre-demographic dividendQatarRomaniaRussian FederationRwandaSamoaSan MarinoSao Tome and PrincipeSaudi ArabiaSenegalSerbiaSeychellesSierra LeoneSingaporeSint Maarten (Dutch part)Slovak RepublicSloveniaSmall statesSolomon IslandsSomaliaSouth AfricaSouth AsiaSouth Asia (IDA & IBRD)South SudanSpainSri LankaSt. Kitts and NevisSt. LuciaSt. Vincent and the GrenadinesSub-Saharan Africa Sub-Saharan Africa (excluding high income)Sub-Saharan Africa (IDA & IBRD countries)SudanSurinameSwazilandSwedenSwitzerlandSyrian Arab RepublicTajikistanTanzaniaThailandTimor-LesteTogoTongaTrinidad and TobagoTunisiaTurkeyTurks and Caicos IslandsTuvaluUgandaUkraineUnited Arab EmiratesUnited KingdomUpper middle incomeUruguayUzbekistanVanuatuVenezuela, RBVietnamWest Bank and GazaWorldYemen, Rep.ZambiaZimbabwe Timeline:
This timeline shows a graph from 1971 to 2015 of Guatemala. No data until 1970. Number of actual observations by date: 32.
Source name:
World Development Indicators
Source organization:
UNESCO Institute for Statistics
Categories, topics:
Education
Last updated:
apr 23, 2017
Indicators value changes by year
Maximum:
18.336
jan 1, 1983
At the date of observation
Value
Absolute change
Change from previous value
jan 1, 1971
15.802
+15.802
0.0%
jan 1, 1972
16.229
+0.427
2.7%
jan 1, 1973
15.651
-0.579
-3.57%
jan 1, 1976
14.833
-0.817
-5.22%
jan 1, 1977
14.123
-0.71
-4.78%
jan 1, 1978
15.217
+1.093
7.74%
jan 1, 1979
15.15
-0.066
-0.44%
jan 1, 1980
14.667
-0.484
-3.19%
jan 1, 1981
14.971
+0.304
2.08%
jan 1, 1982
15.842
+0.871
5.82%
jan 1, 1983
18.336
+2.494
15.74%
jan 1, 1984
15.432
-2.904
-15.84%
jan 1, 1985
15.309
-0.123
-0.8%
jan 1, 1986
13.093
-2.216
-14.47%
jan 1, 1987
4.327
-8.767
-66.96%
jan 1, 1994
16.209
+11.882
274.64%
jan 1, 1997
15.289
-0.92
-5.67%
jan 1, 2000
14.859
-0.43
-2.81%
jan 1, 2001
14.481
-0.379
-2.55%
jan 1, 2002
14.197
-0.283
-1.95%
jan 1, 2003
14.111
-0.086
-0.61%
jan 1, 2005
13.286
-0.825
-5.85%
jan 1, 2006
12.505
-0.781
-5.88%
jan 1, 2007
12.092
-0.413
-3.31%
jan 1, 2008
12.221
+0.129
1.07%
jan 1, 2009
12.45
+0.229
1.87%
jan 1, 2010
10.8
-1.649
-13.25%
jan 1, 2011
11.933
+1.133
10.49%
jan 1, 2012
10.957
-0.976
-8.18%
jan 1, 2013
12.24
+1.283
11.71%
jan 1, 2014
10.517
-1.722
-14.07%
jan 1, 2015
9.309
-1.209
-11.49%
Ranking of countries by current statistics by years


Comments: