29
/
en
AIzaSyAYiBZKx7MnpbEhh9jyipgxe19OcubqV5w
April 1, 2024
24265
Arab World
ARB
false
2
1
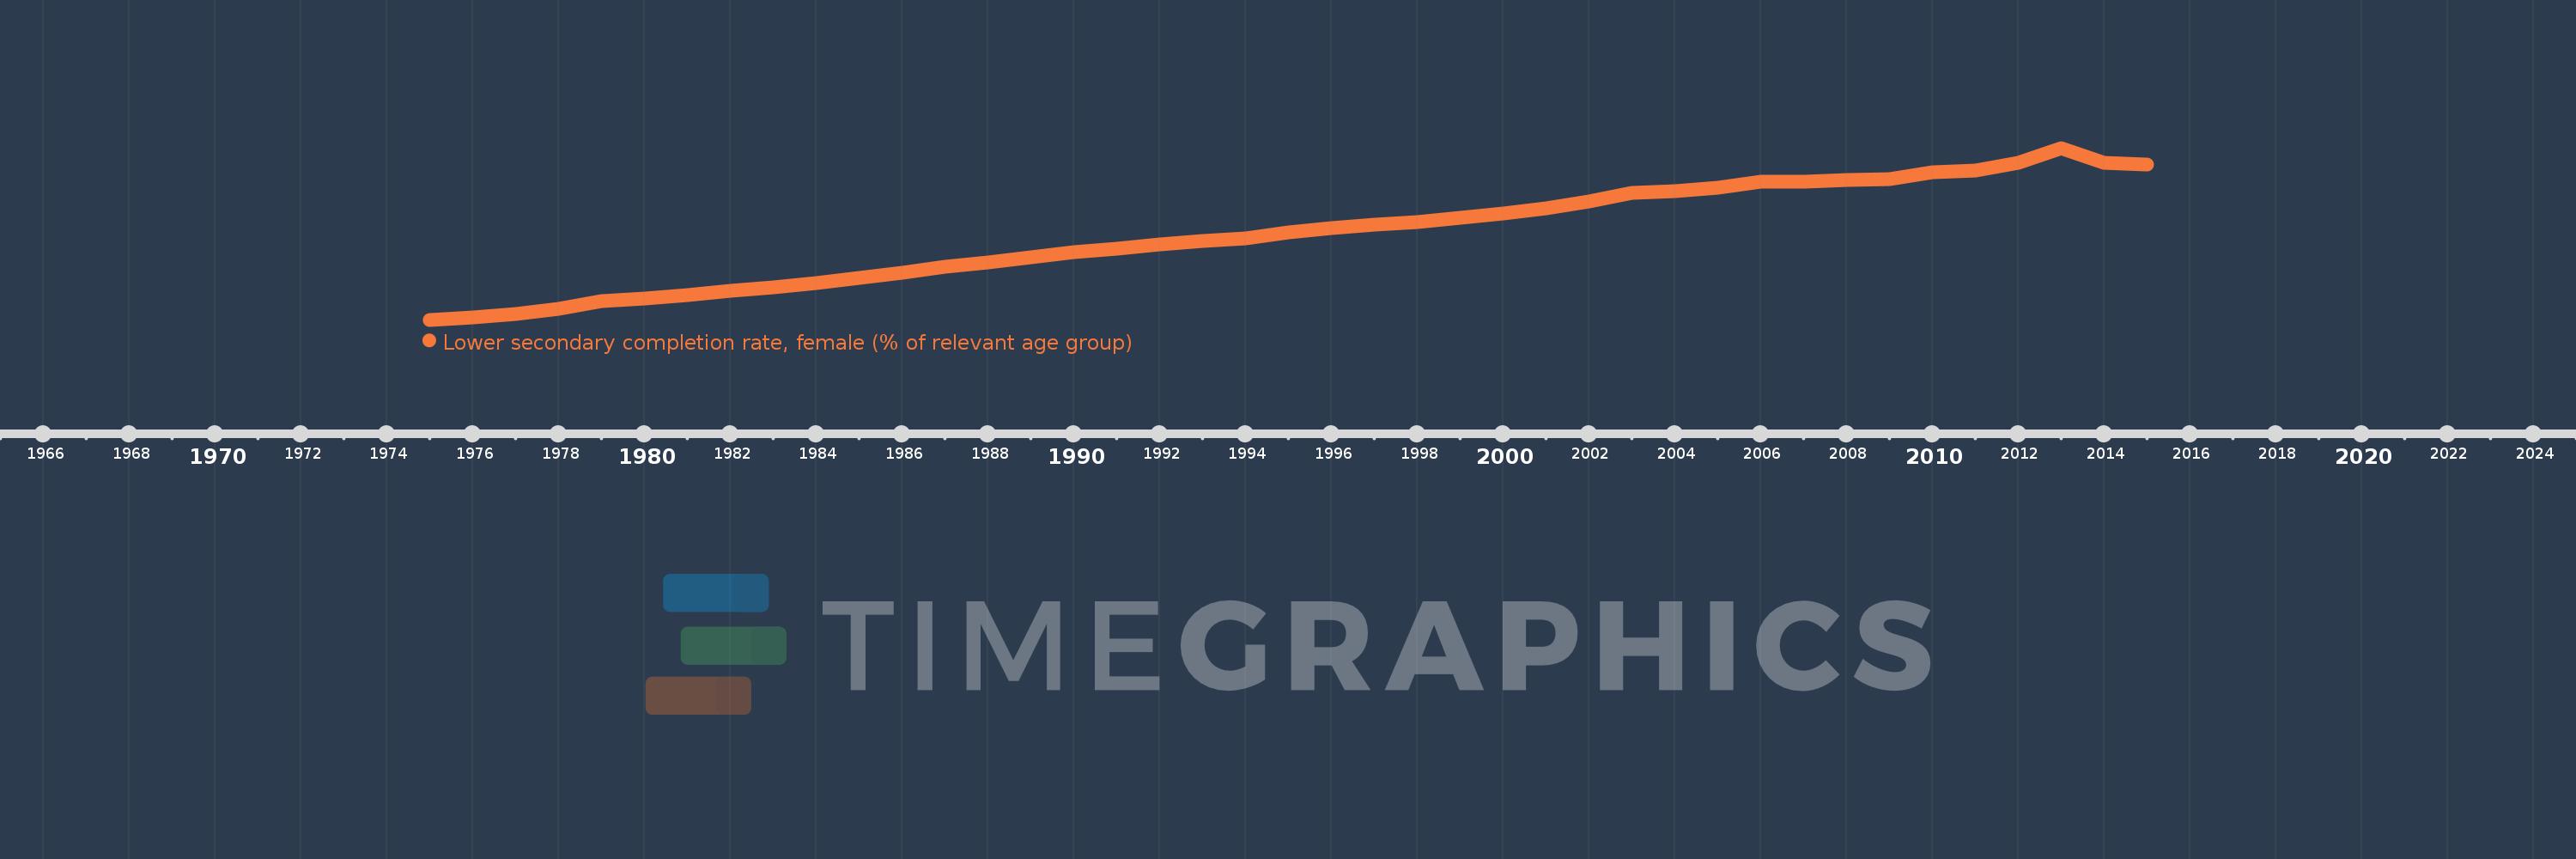
Lower secondary completion rate, female (% of relevant age group)
2015,2014,2013,2012,2011,2010,2009,2008,2007,2006,2005,2004,2003,2002,2001,2000,1999,1998,1997,1996,1995,1994,1993,1992,1991,1990,1989,1988,1987,1986,1985,1984,1983,1982,1981,1980,1979,1978,1977,1976,1975
This statistics in other country:
AfghanistanAlbaniaAlgeriaAngolaAntigua and BarbudaArab WorldArgentinaArmeniaArubaAustriaAzerbaijanBahamas, TheBahrainBangladeshBarbadosBelarusBelgiumBelizeBeninBermudaBhutanBoliviaBosnia and HerzegovinaBotswanaBrunei DarussalamBulgariaBurkina FasoBurundiCabo VerdeCambodiaCameroonCaribbean small statesCentral African RepublicCentral Europe and the BalticsChadChileChinaColombiaComorosCongo, Dem. Rep.Congo, Rep.Costa RicaCote d'IvoireCroatiaCubaCyprusCzech RepublicDenmarkDjiboutiDominicaDominican RepublicEarly-demographic dividendEast Asia & PacificEast Asia & Pacific (excluding high income)East Asia & Pacific (IDA & IBRD countries)EcuadorEgypt, Arab Rep.El SalvadorEquatorial GuineaEritreaEstoniaEthiopiaEuro areaEurope & Central AsiaEurope & Central Asia (excluding high income)Europe & Central Asia (IDA & IBRD countries)European UnionFijiFinlandFragile and conflict affected situationsFranceGabonGambia, TheGeorgiaGermanyGhanaGreeceGrenadaGuatemalaGuineaGuinea-BissauGuyanaHaitiHeavily indebted poor countries (HIPC)High incomeHondurasHong Kong SAR, ChinaHungaryIBRD onlyIcelandIDA & IBRD totalIDA blendIDA onlyIDA totalIndiaIndonesiaIran, Islamic Rep.IraqIrelandIsraelItalyJamaicaJapanJordanKazakhstanKenyaKiribatiKorea, Dem. People’s Rep.Korea, Rep.KuwaitKyrgyz RepublicLao PDRLate-demographic dividendLatin America & Caribbean Latin America & Caribbean (excluding high income)Latin America & the Caribbean (IDA & IBRD countries)LatviaLeast developed countries: UN classificationLebanonLesothoLiberiaLiechtensteinLithuaniaLow & middle incomeLow incomeLower middle incomeLuxembourgMacao SAR, ChinaMacedonia, FYRMadagascarMalawiMaldivesMaliMaltaMarshall IslandsMauritaniaMauritiusMexicoMiddle East & North AfricaMiddle East & North Africa (excluding high income)Middle East & North Africa (IDA & IBRD countries)Middle incomeMoldovaMongoliaMontenegroMoroccoMozambiqueMyanmarNamibiaNauruNepalNetherlandsNicaraguaNigerNorwayOECD membersOmanOther small statesPacific island small statesPakistanPalauPanamaPapua New GuineaParaguayPeruPhilippinesPolandPortugalPost-demographic dividendPre-demographic dividendQatarRomaniaRussian FederationRwandaSamoaSan MarinoSao Tome and PrincipeSaudi ArabiaSenegalSerbiaSeychellesSierra LeoneSlovak RepublicSloveniaSmall statesSolomon IslandsSouth AfricaSouth AsiaSouth Asia (IDA & IBRD)South SudanSpainSri LankaSt. Kitts and NevisSt. LuciaSt. Vincent and the GrenadinesSub-Saharan Africa Sub-Saharan Africa (excluding high income)Sub-Saharan Africa (IDA & IBRD countries)SudanSurinameSwazilandSwedenSwitzerlandSyrian Arab RepublicTajikistanTanzaniaThailandTimor-LesteTogoTongaTrinidad and TobagoTunisiaTurkeyTuvaluUgandaUkraineUnited Arab EmiratesUpper middle incomeUruguayUzbekistanVanuatuVenezuela, RBVietnamWest Bank and GazaWorldYemen, Rep.ZambiaZimbabwe Timeline:
This timeline shows a graph from 1975 to 2015 of Arab World. No data until 1974. Number of actual observations by date: 41.
Source name:
World Development Indicators
Source organization:
United Nations Educational, Scientific, and Cultural Organization (UNESCO) Institute for Statistics.
Categories, topics:
Education
Last updated:
apr 23, 2017
Indicators value changes by year
At the date of observation
Value
Absolute change
Change from previous value
jan 1, 1975
21.43
+21.43
0.0%
jan 1, 1976
22.095
+0.665
3.1%
jan 1, 1977
23.123
+1.028
4.65%
jan 1, 1978
24.621
+1.499
6.48%
jan 1, 1979
26.8
+2.179
8.85%
jan 1, 1980
27.54
+0.739
2.76%
jan 1, 1981
28.543
+1.003
3.64%
jan 1, 1982
29.695
+1.153
4.04%
jan 1, 1983
30.752
+1.057
3.56%
jan 1, 1984
32.027
+1.275
4.14%
jan 1, 1985
33.563
+1.536
4.8%
jan 1, 1986
35.011
+1.448
4.31%
jan 1, 1987
36.675
+1.664
4.75%
jan 1, 1988
38.051
+1.375
3.75%
jan 1, 1989
39.381
+1.33
3.5%
jan 1, 1990
41.019
+1.639
4.16%
jan 1, 1991
41.803
+0.784
1.91%
jan 1, 1992
43.027
+1.224
2.93%
jan 1, 1993
44.083
+1.055
2.45%
jan 1, 1994
44.962
+0.88
2.0%
jan 1, 1995
46.674
+1.712
3.81%
jan 1, 1996
47.911
+1.237
2.65%
jan 1, 1997
48.784
+0.873
1.82%
jan 1, 1998
49.462
+0.678
1.39%
jan 1, 1999
50.769
+1.307
2.64%
jan 1, 2000
52.126
+1.357
2.67%
jan 1, 2001
53.575
+1.45
2.78%
jan 1, 2002
55.555
+1.98
3.7%
jan 1, 2003
57.882
+2.326
4.19%
jan 1, 2004
58.378
+0.496
0.86%
jan 1, 2005
59.443
+1.065
1.82%
jan 1, 2006
61.282
+1.839
3.09%
jan 1, 2007
61.167
-0.115
-0.19%
jan 1, 2008
61.69
+0.523
0.85%
jan 1, 2009
61.979
+0.289
0.47%
jan 1, 2010
63.898
+1.92
3.1%
jan 1, 2011
64.528
+0.629
0.99%
jan 1, 2012
66.653
+2.126
3.29%
jan 1, 2013
70.93
+4.276
6.42%
jan 1, 2014
66.768
-4.162
-5.87%
jan 1, 2015
66.2
-0.568
-0.85%
Ranking of countries by current statistics by years


Comments: