29
/
en
AIzaSyAYiBZKx7MnpbEhh9jyipgxe19OcubqV5w
April 1, 2024
43616
Latin America & the Caribbean (IDA & IBRD countries)
TLA
false
2
1
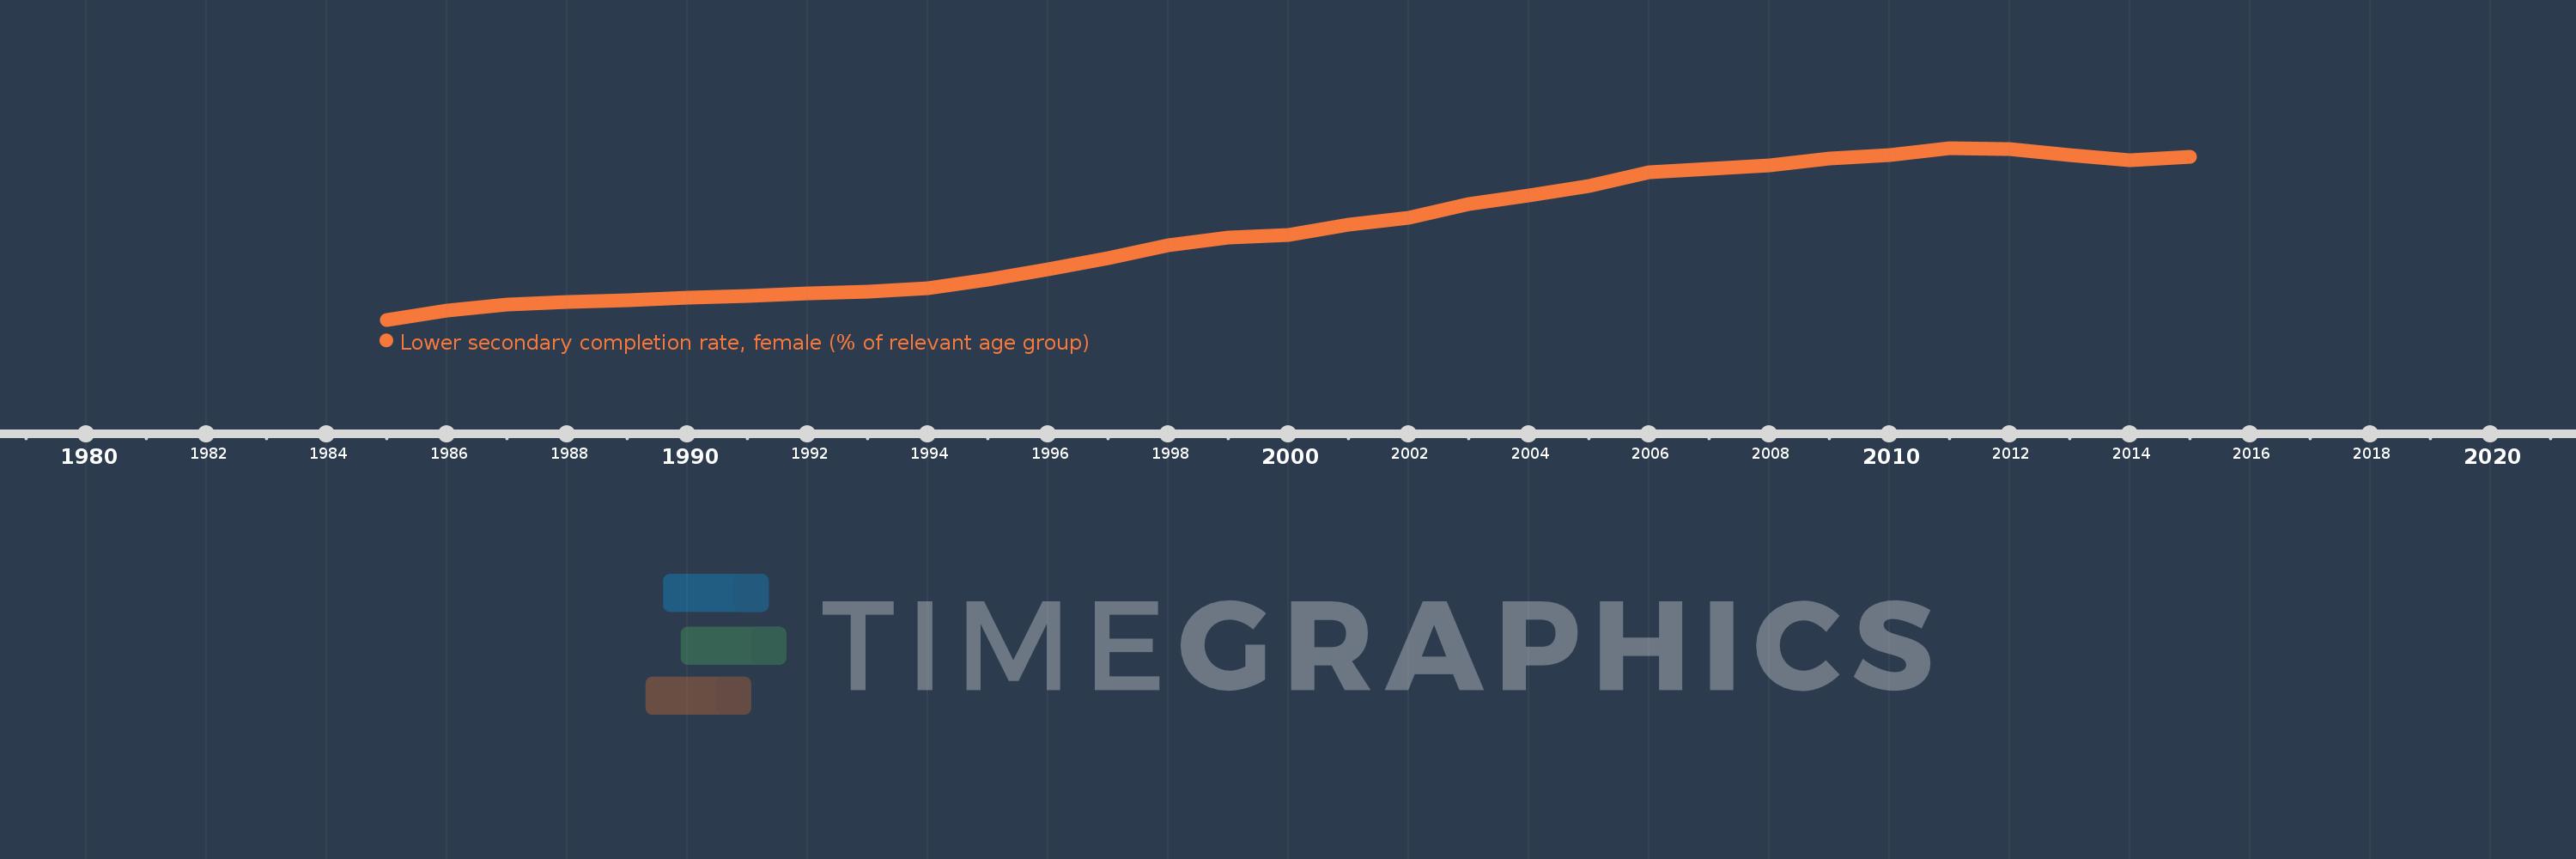
Lower secondary completion rate, female (% of relevant age group)
2015,2014,2013,2012,2011,2010,2009,2008,2007,2006,2005,2004,2003,2002,2001,2000,1999,1998,1997,1996,1995,1994,1993,1992,1991,1990,1989,1988,1987,1986,1985
This statistics in other country:
AfghanistanAlbaniaAlgeriaAngolaAntigua and BarbudaArab WorldArgentinaArmeniaArubaAustriaAzerbaijanBahamas, TheBahrainBangladeshBarbadosBelarusBelgiumBelizeBeninBermudaBhutanBoliviaBosnia and HerzegovinaBotswanaBrunei DarussalamBulgariaBurkina FasoBurundiCabo VerdeCambodiaCameroonCaribbean small statesCentral African RepublicCentral Europe and the BalticsChadChileChinaColombiaComorosCongo, Dem. Rep.Congo, Rep.Costa RicaCote d'IvoireCroatiaCubaCyprusCzech RepublicDenmarkDjiboutiDominicaDominican RepublicEarly-demographic dividendEast Asia & PacificEast Asia & Pacific (excluding high income)East Asia & Pacific (IDA & IBRD countries)EcuadorEgypt, Arab Rep.El SalvadorEquatorial GuineaEritreaEstoniaEthiopiaEuro areaEurope & Central AsiaEurope & Central Asia (excluding high income)Europe & Central Asia (IDA & IBRD countries)European UnionFijiFinlandFragile and conflict affected situationsFranceGabonGambia, TheGeorgiaGermanyGhanaGreeceGrenadaGuatemalaGuineaGuinea-BissauGuyanaHaitiHeavily indebted poor countries (HIPC)High incomeHondurasHong Kong SAR, ChinaHungaryIBRD onlyIcelandIDA & IBRD totalIDA blendIDA onlyIDA totalIndiaIndonesiaIran, Islamic Rep.IraqIrelandIsraelItalyJamaicaJapanJordanKazakhstanKenyaKiribatiKorea, Dem. People’s Rep.Korea, Rep.KuwaitKyrgyz RepublicLao PDRLate-demographic dividendLatin America & Caribbean Latin America & Caribbean (excluding high income)Latin America & the Caribbean (IDA & IBRD countries)LatviaLeast developed countries: UN classificationLebanonLesothoLiberiaLiechtensteinLithuaniaLow & middle incomeLow incomeLower middle incomeLuxembourgMacao SAR, ChinaMacedonia, FYRMadagascarMalawiMaldivesMaliMaltaMarshall IslandsMauritaniaMauritiusMexicoMiddle East & North AfricaMiddle East & North Africa (excluding high income)Middle East & North Africa (IDA & IBRD countries)Middle incomeMoldovaMongoliaMontenegroMoroccoMozambiqueMyanmarNamibiaNauruNepalNetherlandsNicaraguaNigerNorwayOECD membersOmanOther small statesPacific island small statesPakistanPalauPanamaPapua New GuineaParaguayPeruPhilippinesPolandPortugalPost-demographic dividendPre-demographic dividendQatarRomaniaRussian FederationRwandaSamoaSan MarinoSao Tome and PrincipeSaudi ArabiaSenegalSerbiaSeychellesSierra LeoneSlovak RepublicSloveniaSmall statesSolomon IslandsSouth AfricaSouth AsiaSouth Asia (IDA & IBRD)South SudanSpainSri LankaSt. Kitts and NevisSt. LuciaSt. Vincent and the GrenadinesSub-Saharan Africa Sub-Saharan Africa (excluding high income)Sub-Saharan Africa (IDA & IBRD countries)SudanSurinameSwazilandSwedenSwitzerlandSyrian Arab RepublicTajikistanTanzaniaThailandTimor-LesteTogoTongaTrinidad and TobagoTunisiaTurkeyTuvaluUgandaUkraineUnited Arab EmiratesUpper middle incomeUruguayUzbekistanVanuatuVenezuela, RBVietnamWest Bank and GazaWorldYemen, Rep.ZambiaZimbabwe Timeline:
This timeline shows a graph from 1985 to 2015 of Latin America & the Caribbean (IDA & IBRD countries). No data until 1984. Number of actual observations by date: 31.
Source name:
World Development Indicators
Source organization:
United Nations Educational, Scientific, and Cultural Organization (UNESCO) Institute for Statistics.
Categories, topics:
Education
Last updated:
apr 23, 2017
Indicators value changes by year
Minimum:
59.725
jan 1, 1985
Maximum:
80.298
jan 1, 2011
At the date of observation
Value
Absolute change
Change from previous value
jan 1, 1985
59.725
+59.725
0.0%
jan 1, 1986
60.876
+1.151
1.93%
jan 1, 1987
61.559
+0.683
1.12%
jan 1, 1988
61.89
+0.331
0.54%
jan 1, 1989
62.054
+0.164
0.26%
jan 1, 1990
62.344
+0.29
0.47%
jan 1, 1991
62.57
+0.226
0.36%
jan 1, 1992
62.856
+0.287
0.46%
jan 1, 1993
63.116
+0.259
0.41%
jan 1, 1994
63.543
+0.427
0.68%
jan 1, 1995
64.567
+1.024
1.61%
jan 1, 1996
65.8
+1.233
1.91%
jan 1, 1997
67.13
+1.329
2.02%
jan 1, 1998
68.603
+1.473
2.19%
jan 1, 1999
69.604
+1.001
1.46%
jan 1, 2000
69.91
+0.307
0.44%
jan 1, 2001
71.102
+1.192
1.71%
jan 1, 2002
71.975
+0.873
1.23%
jan 1, 2003
73.591
+1.616
2.25%
jan 1, 2004
74.564
+0.973
1.32%
jan 1, 2005
75.787
+1.224
1.64%
jan 1, 2006
77.37
+1.582
2.09%
jan 1, 2007
77.748
+0.378
0.49%
jan 1, 2008
78.253
+0.505
0.65%
jan 1, 2009
79.052
+0.799
1.02%
jan 1, 2010
79.406
+0.354
0.45%
jan 1, 2011
80.298
+0.893
1.12%
jan 1, 2012
80.163
-0.135
-0.17%
jan 1, 2013
79.446
-0.717
-0.89%
jan 1, 2014
78.855
-0.591
-0.74%
jan 1, 2015
79.219
+0.365
0.46%
Ranking of countries by current statistics by years


Comments: