29
/
en
AIzaSyAYiBZKx7MnpbEhh9jyipgxe19OcubqV5w
April 1, 2024
281241
Venezuela, RB
VEN
true
2
1
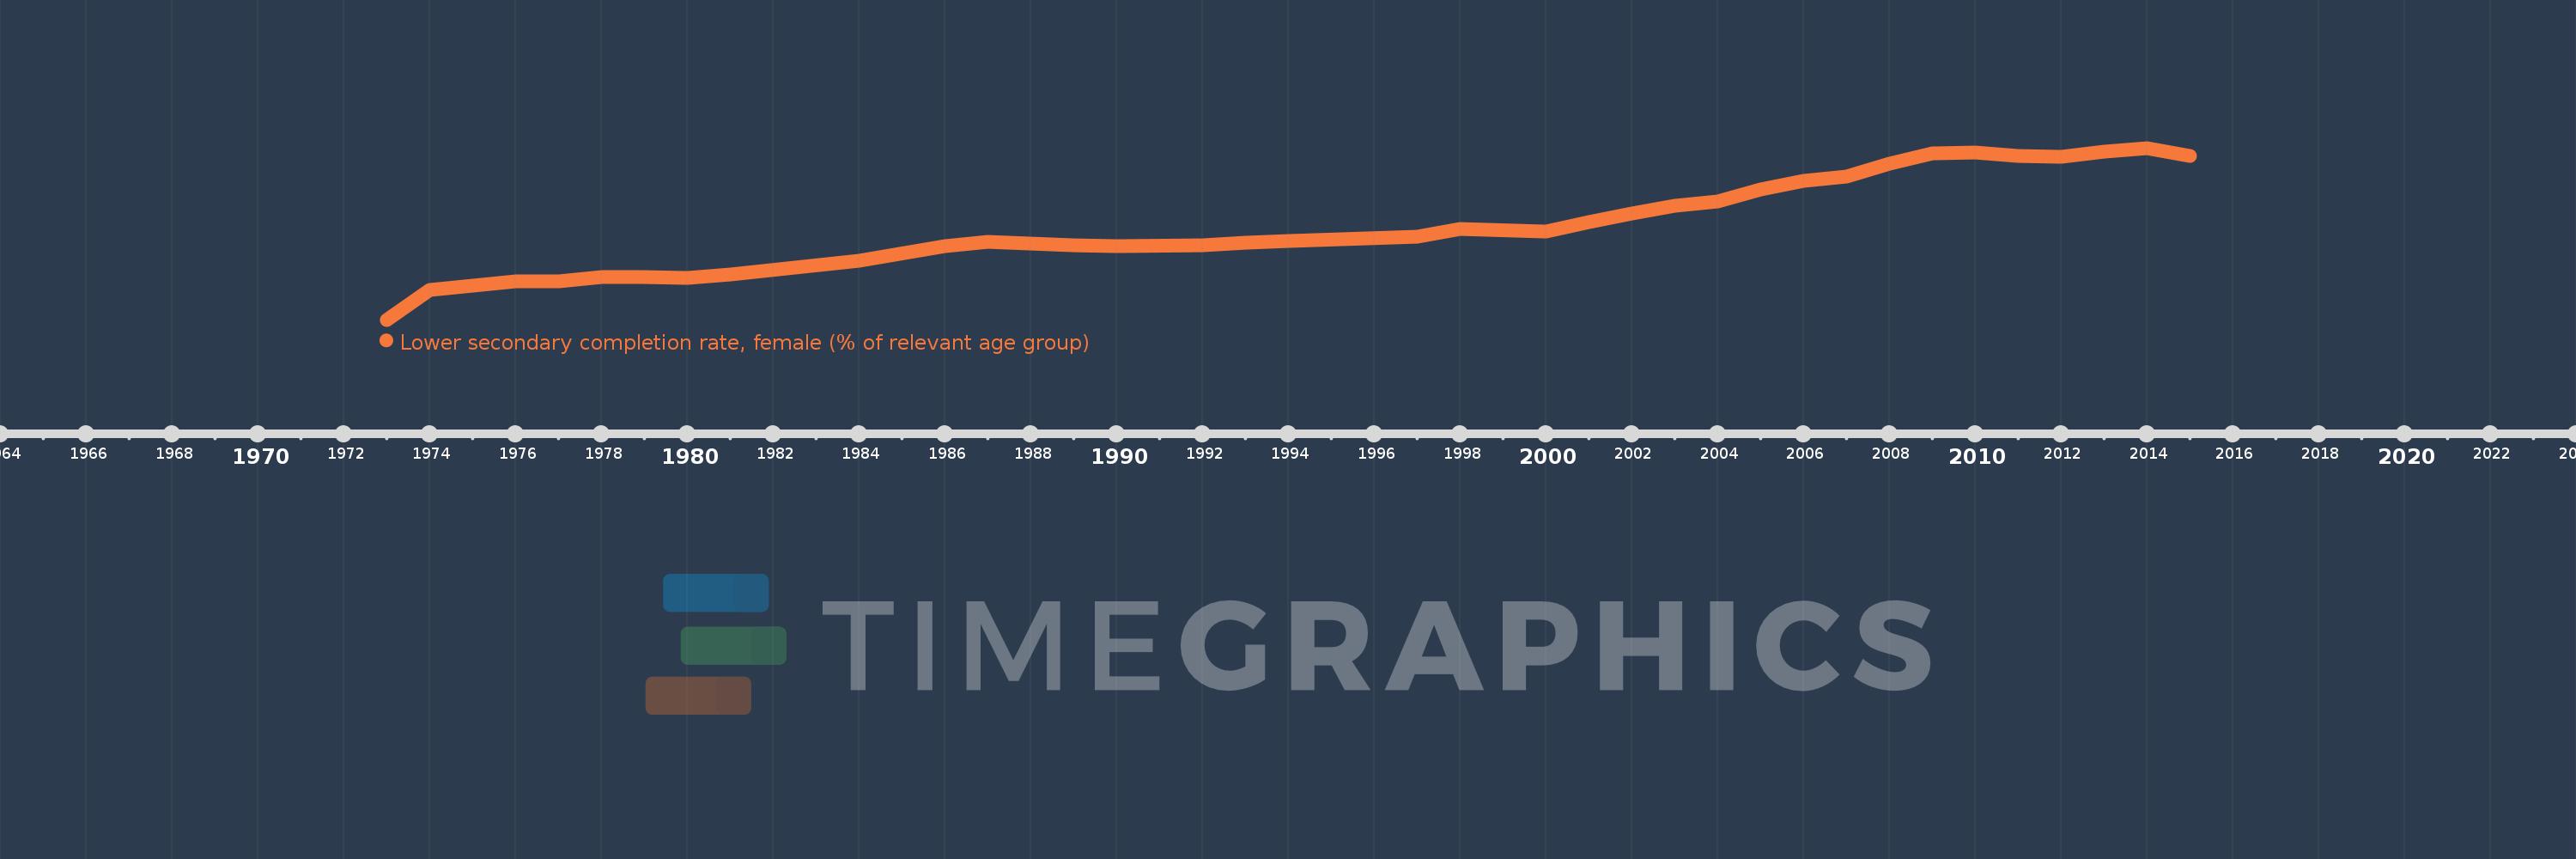
Lower secondary completion rate, female (% of relevant age group)
2015,2014,2013,2012,2011,2010,2009,2008,2007,2006,2005,2004,2003,2002,2001,2000,1998,1997,1994,1993,1992,1990,1989,1988,1987,1986,1984,1981,1980,1979,1978,1977,1976,1975,1974,1973
This statistics in other country:
AfghanistanAlbaniaAlgeriaAngolaAntigua and BarbudaArab WorldArgentinaArmeniaArubaAustriaAzerbaijanBahamas, TheBahrainBangladeshBarbadosBelarusBelgiumBelizeBeninBermudaBhutanBoliviaBosnia and HerzegovinaBotswanaBrunei DarussalamBulgariaBurkina FasoBurundiCabo VerdeCambodiaCameroonCaribbean small statesCentral African RepublicCentral Europe and the BalticsChadChileChinaColombiaComorosCongo, Dem. Rep.Congo, Rep.Costa RicaCote d'IvoireCroatiaCubaCyprusCzech RepublicDenmarkDjiboutiDominicaDominican RepublicEarly-demographic dividendEast Asia & PacificEast Asia & Pacific (excluding high income)East Asia & Pacific (IDA & IBRD countries)EcuadorEgypt, Arab Rep.El SalvadorEquatorial GuineaEritreaEstoniaEthiopiaEuro areaEurope & Central AsiaEurope & Central Asia (excluding high income)Europe & Central Asia (IDA & IBRD countries)European UnionFijiFinlandFragile and conflict affected situationsFranceGabonGambia, TheGeorgiaGermanyGhanaGreeceGrenadaGuatemalaGuineaGuinea-BissauGuyanaHaitiHeavily indebted poor countries (HIPC)High incomeHondurasHong Kong SAR, ChinaHungaryIBRD onlyIcelandIDA & IBRD totalIDA blendIDA onlyIDA totalIndiaIndonesiaIran, Islamic Rep.IraqIrelandIsraelItalyJamaicaJapanJordanKazakhstanKenyaKiribatiKorea, Dem. People’s Rep.Korea, Rep.KuwaitKyrgyz RepublicLao PDRLate-demographic dividendLatin America & Caribbean Latin America & Caribbean (excluding high income)Latin America & the Caribbean (IDA & IBRD countries)LatviaLeast developed countries: UN classificationLebanonLesothoLiberiaLiechtensteinLithuaniaLow & middle incomeLow incomeLower middle incomeLuxembourgMacao SAR, ChinaMacedonia, FYRMadagascarMalawiMaldivesMaliMaltaMarshall IslandsMauritaniaMauritiusMexicoMiddle East & North AfricaMiddle East & North Africa (excluding high income)Middle East & North Africa (IDA & IBRD countries)Middle incomeMoldovaMongoliaMontenegroMoroccoMozambiqueMyanmarNamibiaNauruNepalNetherlandsNicaraguaNigerNorwayOECD membersOmanOther small statesPacific island small statesPakistanPalauPanamaPapua New GuineaParaguayPeruPhilippinesPolandPortugalPost-demographic dividendPre-demographic dividendQatarRomaniaRussian FederationRwandaSamoaSan MarinoSao Tome and PrincipeSaudi ArabiaSenegalSerbiaSeychellesSierra LeoneSlovak RepublicSloveniaSmall statesSolomon IslandsSouth AfricaSouth AsiaSouth Asia (IDA & IBRD)South SudanSpainSri LankaSt. Kitts and NevisSt. LuciaSt. Vincent and the GrenadinesSub-Saharan Africa Sub-Saharan Africa (excluding high income)Sub-Saharan Africa (IDA & IBRD countries)SudanSurinameSwazilandSwedenSwitzerlandSyrian Arab RepublicTajikistanTanzaniaThailandTimor-LesteTogoTongaTrinidad and TobagoTunisiaTurkeyTuvaluUgandaUkraineUnited Arab EmiratesUpper middle incomeUruguayUzbekistanVanuatuVenezuela, RBVietnamWest Bank and GazaWorldYemen, Rep.ZambiaZimbabwe Timeline:
This timeline shows a graph from 1973 to 2015 of Venezuela, RB. No data until 1972. Number of actual observations by date: 36.
Source name:
World Development Indicators
Source organization:
United Nations Educational, Scientific, and Cultural Organization (UNESCO) Institute for Statistics.
Categories, topics:
Education
Last updated:
apr 23, 2017
Indicators value changes by year
Minimum:
22.433
jan 1, 1973
Maximum:
83.985
jan 1, 2014
At the date of observation
Value
Absolute change
Change from previous value
jan 1, 1973
22.433
+22.433
0.0%
jan 1, 1974
33.12
+10.687
47.64%
jan 1, 1975
34.792
+1.672
5.05%
jan 1, 1976
36.291
+1.499
4.31%
jan 1, 1977
36.28
-0.011
-0.03%
jan 1, 1978
37.579
+1.299
3.58%
jan 1, 1979
37.623
+0.044
0.12%
jan 1, 1980
37.462
-0.161
-0.43%
jan 1, 1981
38.554
+1.092
2.92%
jan 1, 1984
43.483
+4.929
12.78%
jan 1, 1986
48.665
+5.183
11.92%
jan 1, 1987
50.285
+1.62
3.33%
jan 1, 1988
49.609
-0.676
-1.34%
jan 1, 1989
49.171
-0.438
-0.88%
jan 1, 1990
48.817
-0.354
-0.72%
jan 1, 1992
49.217
+0.4
0.82%
jan 1, 1993
50.171
+0.955
1.94%
jan 1, 1994
50.713
+0.542
1.08%
jan 1, 1997
52.322
+1.609
3.17%
jan 1, 1998
55.085
+2.763
5.28%
jan 1, 2000
54.191
-0.895
-1.62%
jan 1, 2001
57.525
+3.334
6.15%
jan 1, 2002
60.417
+2.892
5.03%
jan 1, 2003
63.342
+2.924
4.84%
jan 1, 2004
64.962
+1.621
2.56%
jan 1, 2005
69.015
+4.052
6.24%
jan 1, 2006
72.08
+3.066
4.44%
jan 1, 2007
73.875
+1.795
2.49%
jan 1, 2008
78.339
+4.464
6.04%
jan 1, 2009
82.177
+3.837
4.9%
jan 1, 2010
82.34
+0.164
0.2%
jan 1, 2011
80.984
-1.357
-1.65%
jan 1, 2012
80.958
-0.026
-0.03%
jan 1, 2013
82.638
+1.68
2.08%
jan 1, 2014
83.985
+1.347
1.63%
jan 1, 2015
81.194
-2.791
-3.32%
Ranking of countries by current statistics by years


Comments: