29
/
en
AIzaSyAYiBZKx7MnpbEhh9jyipgxe19OcubqV5w
April 1, 2024
100169
Cameroon
CMR
true
2
1
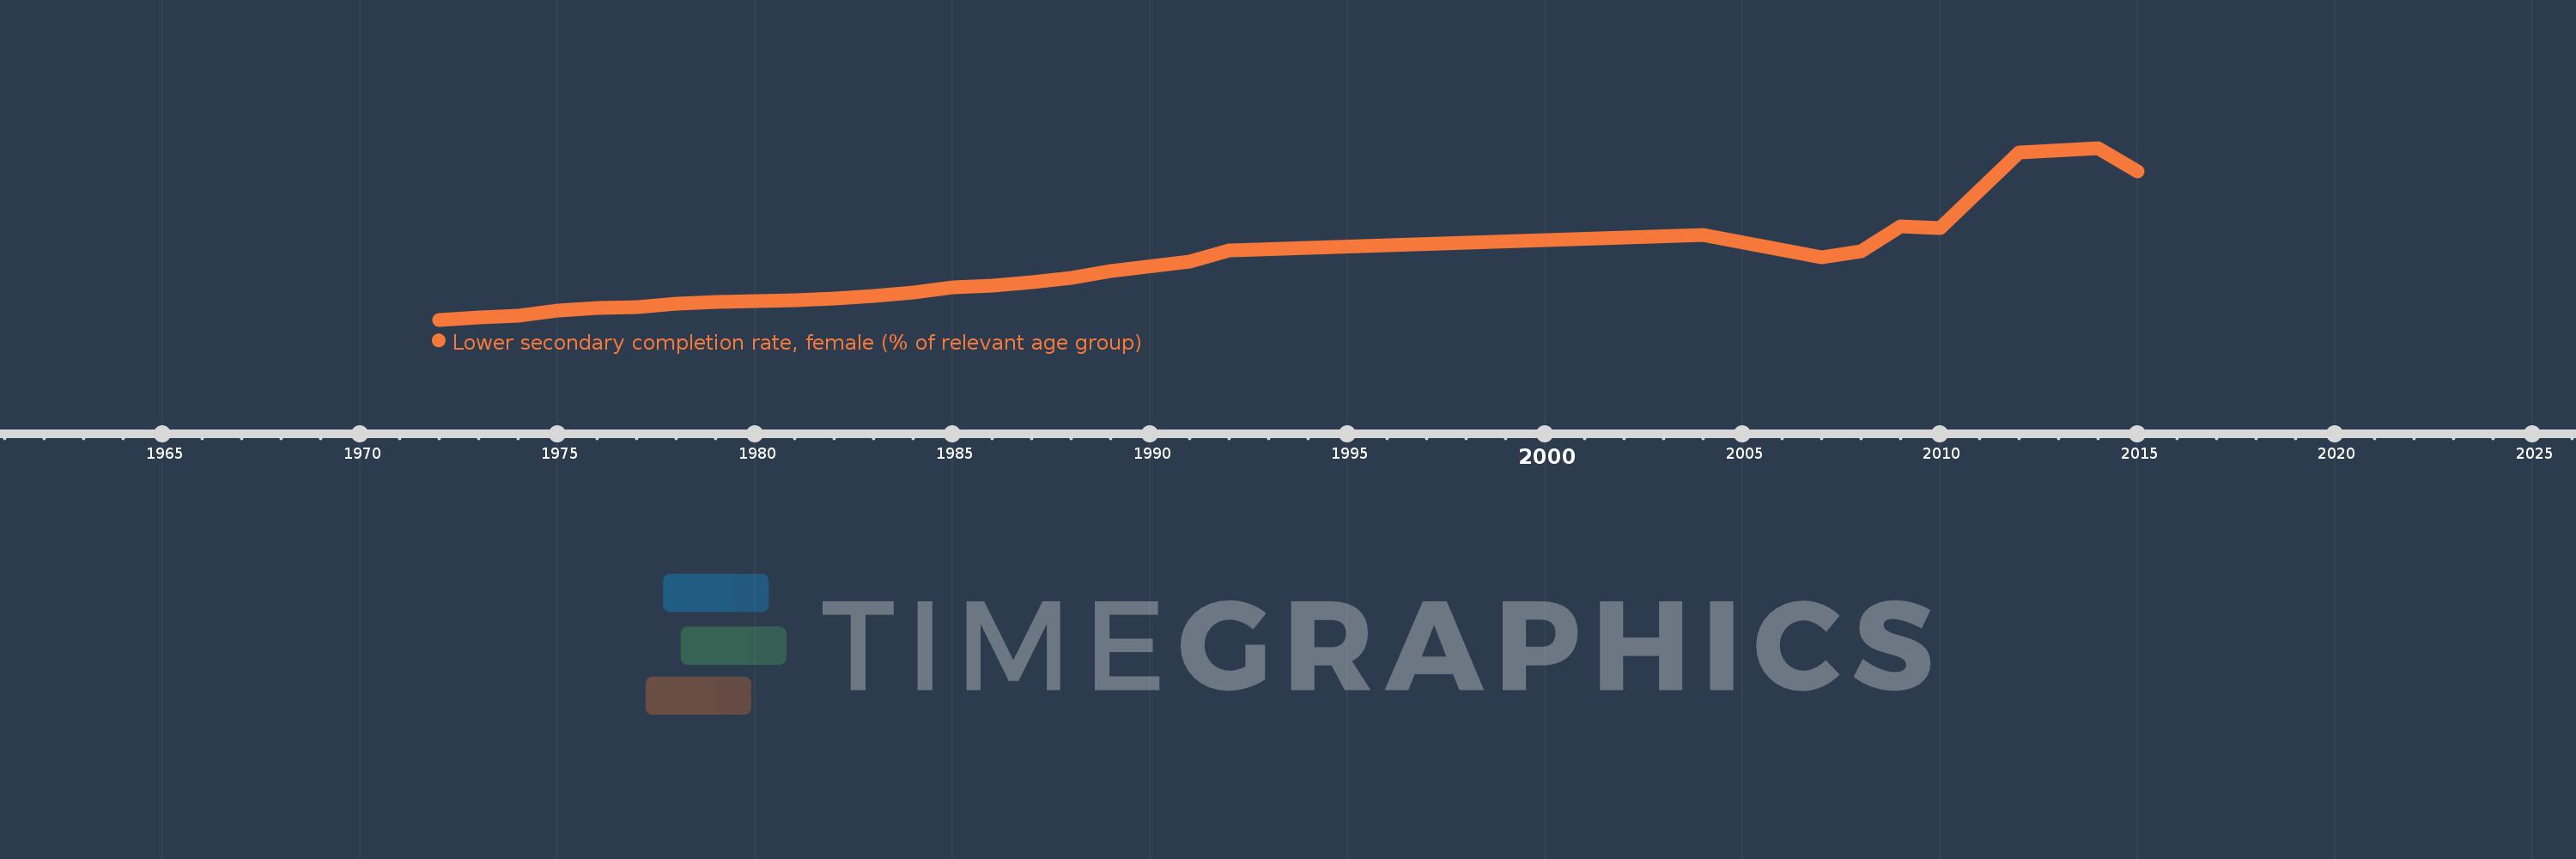
Lower secondary completion rate, female (% of relevant age group)
2015,2014,2012,2010,2009,2008,2007,2004,1992,1991,1989,1988,1987,1986,1985,1984,1983,1982,1981,1980,1979,1978,1977,1976,1975,1974,1973,1972
This statistics in other country:
AfghanistanAlbaniaAlgeriaAngolaAntigua and BarbudaArab WorldArgentinaArmeniaArubaAustriaAzerbaijanBahamas, TheBahrainBangladeshBarbadosBelarusBelgiumBelizeBeninBermudaBhutanBoliviaBosnia and HerzegovinaBotswanaBrunei DarussalamBulgariaBurkina FasoBurundiCabo VerdeCambodiaCameroonCaribbean small statesCentral African RepublicCentral Europe and the BalticsChadChileChinaColombiaComorosCongo, Dem. Rep.Congo, Rep.Costa RicaCote d'IvoireCroatiaCubaCyprusCzech RepublicDenmarkDjiboutiDominicaDominican RepublicEarly-demographic dividendEast Asia & PacificEast Asia & Pacific (excluding high income)East Asia & Pacific (IDA & IBRD countries)EcuadorEgypt, Arab Rep.El SalvadorEquatorial GuineaEritreaEstoniaEthiopiaEuro areaEurope & Central AsiaEurope & Central Asia (excluding high income)Europe & Central Asia (IDA & IBRD countries)European UnionFijiFinlandFragile and conflict affected situationsFranceGabonGambia, TheGeorgiaGermanyGhanaGreeceGrenadaGuatemalaGuineaGuinea-BissauGuyanaHaitiHeavily indebted poor countries (HIPC)High incomeHondurasHong Kong SAR, ChinaHungaryIBRD onlyIcelandIDA & IBRD totalIDA blendIDA onlyIDA totalIndiaIndonesiaIran, Islamic Rep.IraqIrelandIsraelItalyJamaicaJapanJordanKazakhstanKenyaKiribatiKorea, Dem. People’s Rep.Korea, Rep.KuwaitKyrgyz RepublicLao PDRLate-demographic dividendLatin America & Caribbean Latin America & Caribbean (excluding high income)Latin America & the Caribbean (IDA & IBRD countries)LatviaLeast developed countries: UN classificationLebanonLesothoLiberiaLiechtensteinLithuaniaLow & middle incomeLow incomeLower middle incomeLuxembourgMacao SAR, ChinaMacedonia, FYRMadagascarMalawiMaldivesMaliMaltaMarshall IslandsMauritaniaMauritiusMexicoMiddle East & North AfricaMiddle East & North Africa (excluding high income)Middle East & North Africa (IDA & IBRD countries)Middle incomeMoldovaMongoliaMontenegroMoroccoMozambiqueMyanmarNamibiaNauruNepalNetherlandsNicaraguaNigerNorwayOECD membersOmanOther small statesPacific island small statesPakistanPalauPanamaPapua New GuineaParaguayPeruPhilippinesPolandPortugalPost-demographic dividendPre-demographic dividendQatarRomaniaRussian FederationRwandaSamoaSan MarinoSao Tome and PrincipeSaudi ArabiaSenegalSerbiaSeychellesSierra LeoneSlovak RepublicSloveniaSmall statesSolomon IslandsSouth AfricaSouth AsiaSouth Asia (IDA & IBRD)South SudanSpainSri LankaSt. Kitts and NevisSt. LuciaSt. Vincent and the GrenadinesSub-Saharan Africa Sub-Saharan Africa (excluding high income)Sub-Saharan Africa (IDA & IBRD countries)SudanSurinameSwazilandSwedenSwitzerlandSyrian Arab RepublicTajikistanTanzaniaThailandTimor-LesteTogoTongaTrinidad and TobagoTunisiaTurkeyTuvaluUgandaUkraineUnited Arab EmiratesUpper middle incomeUruguayUzbekistanVanuatuVenezuela, RBVietnamWest Bank and GazaWorldYemen, Rep.ZambiaZimbabwe Timeline:
This timeline shows a graph from 1972 to 2015 of Cameroon. No data until 1971. Number of actual observations by date: 28.
Source name:
World Development Indicators
Source organization:
United Nations Educational, Scientific, and Cultural Organization (UNESCO) Institute for Statistics.
Categories, topics:
Education
Last updated:
apr 23, 2017
Indicators value changes by year
Maximum:
39.965
jan 1, 2014
At the date of observation
Value
Absolute change
Change from previous value
jan 1, 1972
2.506
+2.506
0.0%
jan 1, 1973
2.94
+0.434
17.33%
jan 1, 1974
3.444
+0.504
17.14%
jan 1, 1975
4.479
+1.035
30.04%
jan 1, 1976
5.05
+0.571
12.75%
jan 1, 1977
5.276
+0.226
4.47%
jan 1, 1978
6.027
+0.751
14.23%
jan 1, 1979
6.374
+0.347
5.75%
jan 1, 1980
6.618
+0.244
3.83%
jan 1, 1981
6.708
+0.091
1.37%
jan 1, 1982
7.192
+0.484
7.21%
jan 1, 1983
7.709
+0.517
7.18%
jan 1, 1984
8.5
+0.792
10.27%
jan 1, 1985
9.544
+1.043
12.28%
jan 1, 1986
9.899
+0.355
3.72%
jan 1, 1987
10.639
+0.74
7.47%
jan 1, 1988
11.608
+0.969
9.11%
jan 1, 1989
13.163
+1.555
13.4%
jan 1, 1991
15.124
+1.961
14.9%
jan 1, 1992
17.633
+2.51
16.59%
jan 1, 2004
21.022
+3.389
19.22%
jan 1, 2007
16.11
-4.912
-23.36%
jan 1, 2008
17.375
+1.264
7.85%
jan 1, 2009
22.814
+5.44
31.31%
jan 1, 2010
22.452
-0.362
-1.59%
jan 1, 2012
38.979
+16.527
73.61%
jan 1, 2014
39.965
+0.986
2.53%
jan 1, 2015
34.883
-5.082
-12.72%
Ranking of countries by current statistics by years


Comments: