29
/
en
AIzaSyAYiBZKx7MnpbEhh9jyipgxe19OcubqV5w
April 1, 2024
113835
Cote d'Ivoire
CIV
true
2
1
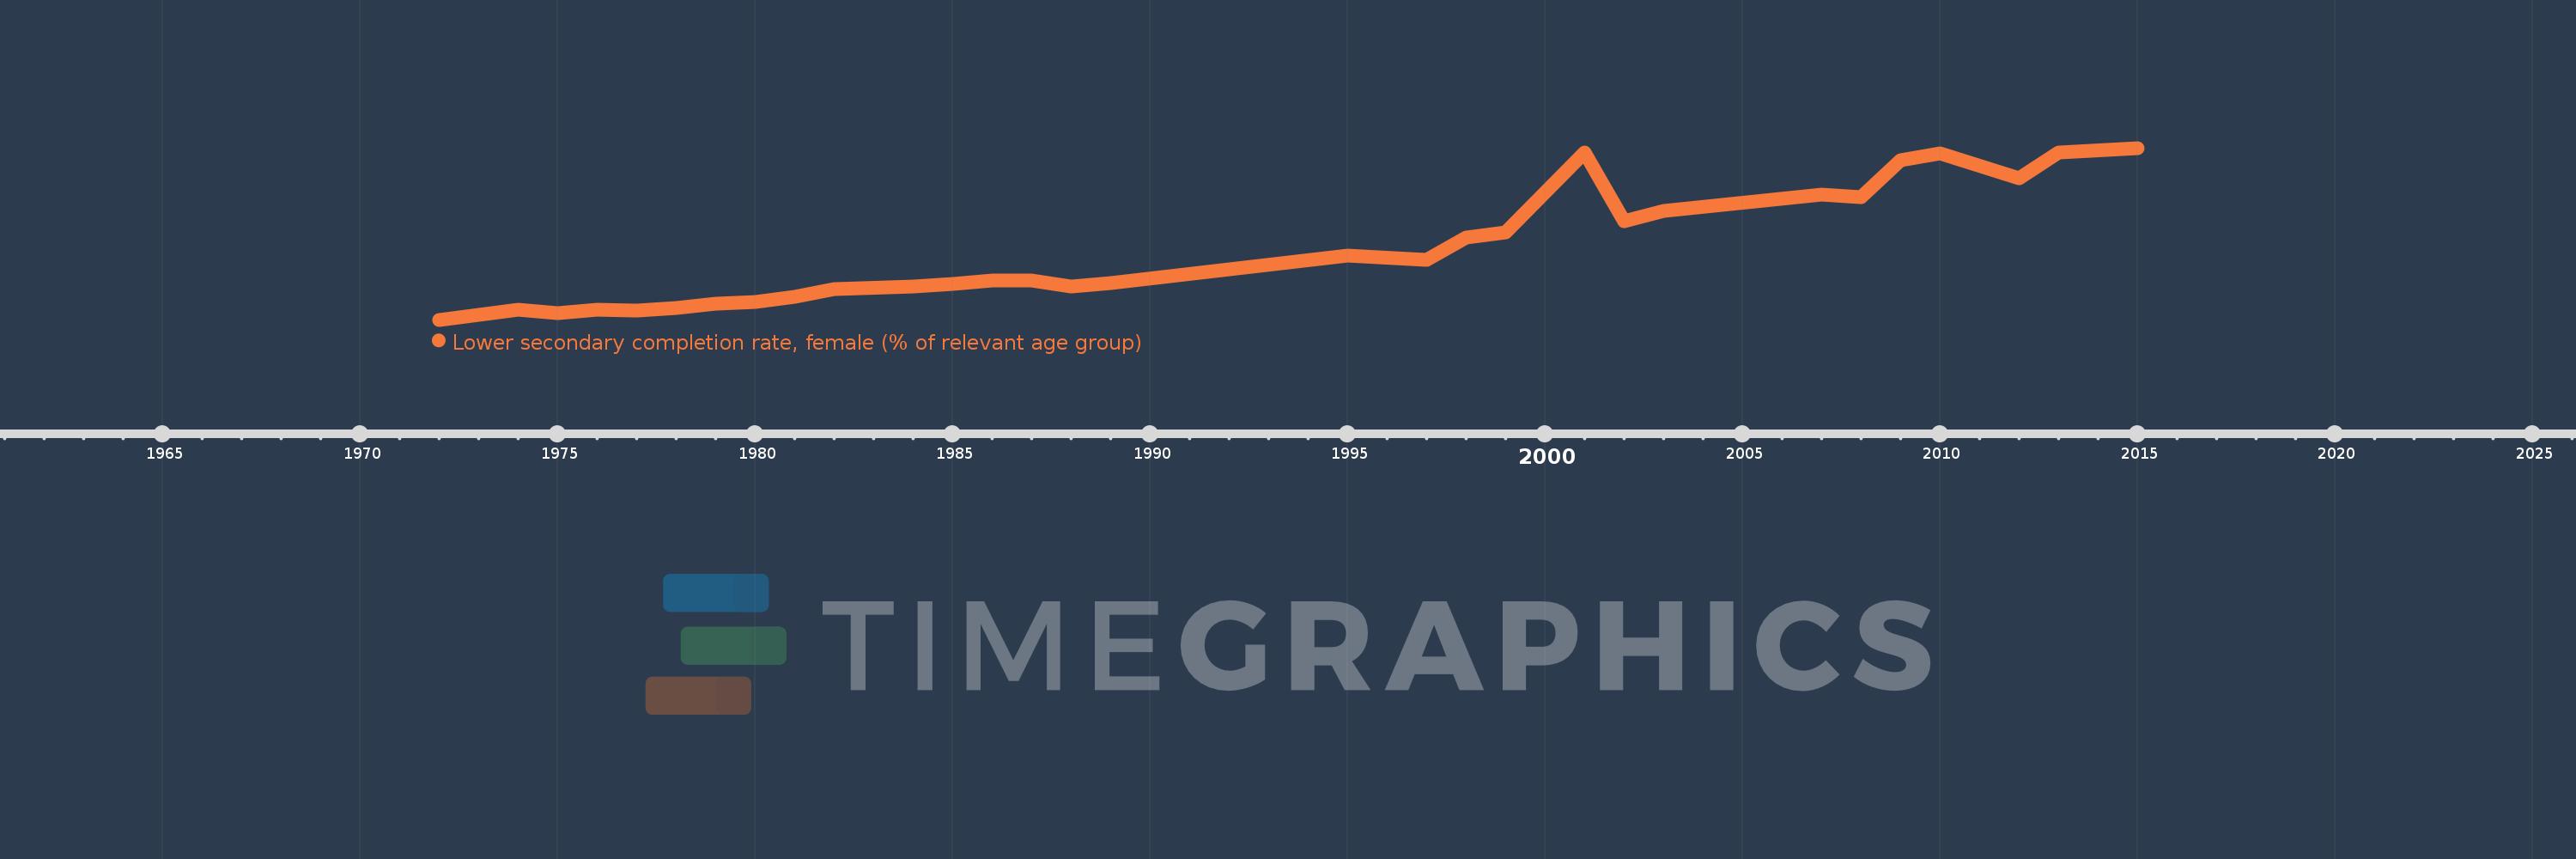
Lower secondary completion rate, female (% of relevant age group)
2015,2013,2012,2010,2009,2008,2007,2003,2002,2001,1999,1998,1997,1995,1989,1988,1987,1986,1985,1984,1982,1981,1980,1979,1978,1977,1976,1975,1974,1972
This statistics in other country:
AfghanistanAlbaniaAlgeriaAngolaAntigua and BarbudaArab WorldArgentinaArmeniaArubaAustriaAzerbaijanBahamas, TheBahrainBangladeshBarbadosBelarusBelgiumBelizeBeninBermudaBhutanBoliviaBosnia and HerzegovinaBotswanaBrunei DarussalamBulgariaBurkina FasoBurundiCabo VerdeCambodiaCameroonCaribbean small statesCentral African RepublicCentral Europe and the BalticsChadChileChinaColombiaComorosCongo, Dem. Rep.Congo, Rep.Costa RicaCote d'IvoireCroatiaCubaCyprusCzech RepublicDenmarkDjiboutiDominicaDominican RepublicEarly-demographic dividendEast Asia & PacificEast Asia & Pacific (excluding high income)East Asia & Pacific (IDA & IBRD countries)EcuadorEgypt, Arab Rep.El SalvadorEquatorial GuineaEritreaEstoniaEthiopiaEuro areaEurope & Central AsiaEurope & Central Asia (excluding high income)Europe & Central Asia (IDA & IBRD countries)European UnionFijiFinlandFragile and conflict affected situationsFranceGabonGambia, TheGeorgiaGermanyGhanaGreeceGrenadaGuatemalaGuineaGuinea-BissauGuyanaHaitiHeavily indebted poor countries (HIPC)High incomeHondurasHong Kong SAR, ChinaHungaryIBRD onlyIcelandIDA & IBRD totalIDA blendIDA onlyIDA totalIndiaIndonesiaIran, Islamic Rep.IraqIrelandIsraelItalyJamaicaJapanJordanKazakhstanKenyaKiribatiKorea, Dem. People’s Rep.Korea, Rep.KuwaitKyrgyz RepublicLao PDRLate-demographic dividendLatin America & Caribbean Latin America & Caribbean (excluding high income)Latin America & the Caribbean (IDA & IBRD countries)LatviaLeast developed countries: UN classificationLebanonLesothoLiberiaLiechtensteinLithuaniaLow & middle incomeLow incomeLower middle incomeLuxembourgMacao SAR, ChinaMacedonia, FYRMadagascarMalawiMaldivesMaliMaltaMarshall IslandsMauritaniaMauritiusMexicoMiddle East & North AfricaMiddle East & North Africa (excluding high income)Middle East & North Africa (IDA & IBRD countries)Middle incomeMoldovaMongoliaMontenegroMoroccoMozambiqueMyanmarNamibiaNauruNepalNetherlandsNicaraguaNigerNorwayOECD membersOmanOther small statesPacific island small statesPakistanPalauPanamaPapua New GuineaParaguayPeruPhilippinesPolandPortugalPost-demographic dividendPre-demographic dividendQatarRomaniaRussian FederationRwandaSamoaSan MarinoSao Tome and PrincipeSaudi ArabiaSenegalSerbiaSeychellesSierra LeoneSlovak RepublicSloveniaSmall statesSolomon IslandsSouth AfricaSouth AsiaSouth Asia (IDA & IBRD)South SudanSpainSri LankaSt. Kitts and NevisSt. LuciaSt. Vincent and the GrenadinesSub-Saharan Africa Sub-Saharan Africa (excluding high income)Sub-Saharan Africa (IDA & IBRD countries)SudanSurinameSwazilandSwedenSwitzerlandSyrian Arab RepublicTajikistanTanzaniaThailandTimor-LesteTogoTongaTrinidad and TobagoTunisiaTurkeyTuvaluUgandaUkraineUnited Arab EmiratesUpper middle incomeUruguayUzbekistanVanuatuVenezuela, RBVietnamWest Bank and GazaWorldYemen, Rep.ZambiaZimbabwe Timeline:
This timeline shows a graph from 1972 to 2015 of Cote d'Ivoire. No data until 1971. Number of actual observations by date: 30.
Source name:
World Development Indicators
Source organization:
United Nations Educational, Scientific, and Cultural Organization (UNESCO) Institute for Statistics.
Categories, topics:
Education
Last updated:
apr 23, 2017
Indicators value changes by year
Maximum:
26.888
jan 1, 2015
At the date of observation
Value
Absolute change
Change from previous value
jan 1, 1972
3.16
+3.16
0.0%
jan 1, 1974
4.493
+1.333
42.17%
jan 1, 1975
4.025
-0.467
-10.4%
jan 1, 1976
4.541
+0.515
12.81%
jan 1, 1977
4.449
-0.092
-2.02%
jan 1, 1978
4.818
+0.369
8.29%
jan 1, 1979
5.364
+0.546
11.33%
jan 1, 1980
5.603
+0.239
4.45%
jan 1, 1981
6.302
+0.699
12.48%
jan 1, 1982
7.417
+1.115
17.69%
jan 1, 1984
7.715
+0.298
4.02%
jan 1, 1985
8.164
+0.449
5.82%
jan 1, 1986
8.594
+0.43
5.26%
jan 1, 1987
8.559
-0.035
-0.41%
jan 1, 1988
7.787
-0.772
-9.02%
jan 1, 1989
8.206
+0.418
5.37%
jan 1, 1995
12.015
+3.809
46.42%
jan 1, 1997
11.487
-0.527
-4.39%
jan 1, 1998
14.566
+3.078
26.79%
jan 1, 1999
15.176
+0.61
4.19%
jan 1, 2001
26.208
+11.032
72.69%
jan 1, 2002
16.724
-9.484
-36.19%
jan 1, 2003
18.143
+1.419
8.48%
jan 1, 2007
20.407
+2.265
12.48%
jan 1, 2008
20.102
-0.305
-1.5%
jan 1, 2009
25.21
+5.109
25.41%
jan 1, 2010
26.168
+0.958
3.8%
jan 1, 2012
22.678
-3.49
-13.34%
jan 1, 2013
26.243
+3.565
15.72%
jan 1, 2015
26.888
+0.644
2.45%
Ranking of countries by current statistics by years


Comments: