29
/
en
AIzaSyAYiBZKx7MnpbEhh9jyipgxe19OcubqV5w
April 1, 2024
255411
Swaziland
SWZ
true
2
1
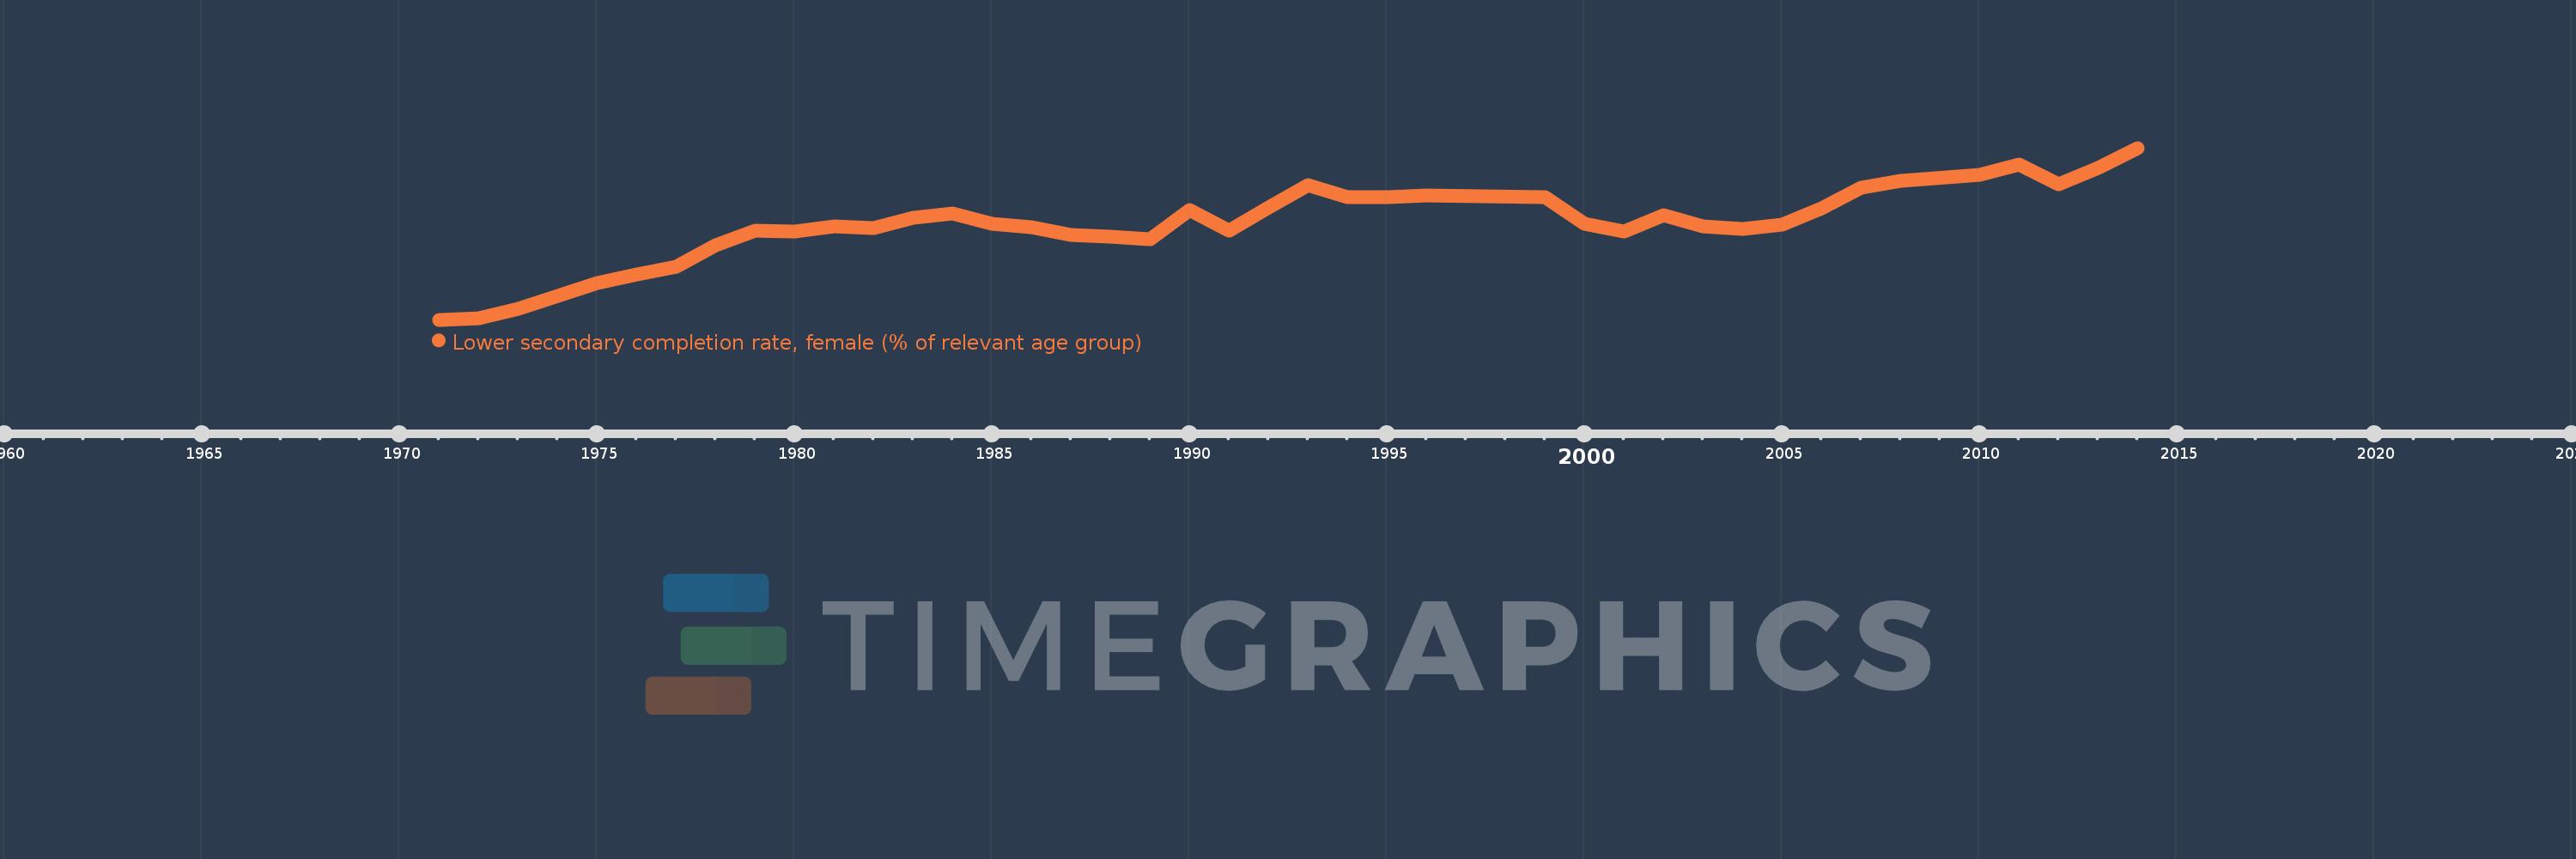
Lower secondary completion rate, female (% of relevant age group)
2014,2013,2012,2011,2010,2008,2007,2006,2005,2004,2003,2002,2001,2000,1999,1996,1995,1994,1993,1992,1991,1990,1989,1988,1987,1986,1985,1984,1983,1982,1981,1980,1979,1978,1977,1976,1975,1974,1973,1972,1971
This statistics in other country:
AfghanistanAlbaniaAlgeriaAngolaAntigua and BarbudaArab WorldArgentinaArmeniaArubaAustriaAzerbaijanBahamas, TheBahrainBangladeshBarbadosBelarusBelgiumBelizeBeninBermudaBhutanBoliviaBosnia and HerzegovinaBotswanaBrunei DarussalamBulgariaBurkina FasoBurundiCabo VerdeCambodiaCameroonCaribbean small statesCentral African RepublicCentral Europe and the BalticsChadChileChinaColombiaComorosCongo, Dem. Rep.Congo, Rep.Costa RicaCote d'IvoireCroatiaCubaCyprusCzech RepublicDenmarkDjiboutiDominicaDominican RepublicEarly-demographic dividendEast Asia & PacificEast Asia & Pacific (excluding high income)East Asia & Pacific (IDA & IBRD countries)EcuadorEgypt, Arab Rep.El SalvadorEquatorial GuineaEritreaEstoniaEthiopiaEuro areaEurope & Central AsiaEurope & Central Asia (excluding high income)Europe & Central Asia (IDA & IBRD countries)European UnionFijiFinlandFragile and conflict affected situationsFranceGabonGambia, TheGeorgiaGermanyGhanaGreeceGrenadaGuatemalaGuineaGuinea-BissauGuyanaHaitiHeavily indebted poor countries (HIPC)High incomeHondurasHong Kong SAR, ChinaHungaryIBRD onlyIcelandIDA & IBRD totalIDA blendIDA onlyIDA totalIndiaIndonesiaIran, Islamic Rep.IraqIrelandIsraelItalyJamaicaJapanJordanKazakhstanKenyaKiribatiKorea, Dem. People’s Rep.Korea, Rep.KuwaitKyrgyz RepublicLao PDRLate-demographic dividendLatin America & Caribbean Latin America & Caribbean (excluding high income)Latin America & the Caribbean (IDA & IBRD countries)LatviaLeast developed countries: UN classificationLebanonLesothoLiberiaLiechtensteinLithuaniaLow & middle incomeLow incomeLower middle incomeLuxembourgMacao SAR, ChinaMacedonia, FYRMadagascarMalawiMaldivesMaliMaltaMarshall IslandsMauritaniaMauritiusMexicoMiddle East & North AfricaMiddle East & North Africa (excluding high income)Middle East & North Africa (IDA & IBRD countries)Middle incomeMoldovaMongoliaMontenegroMoroccoMozambiqueMyanmarNamibiaNauruNepalNetherlandsNicaraguaNigerNorwayOECD membersOmanOther small statesPacific island small statesPakistanPalauPanamaPapua New GuineaParaguayPeruPhilippinesPolandPortugalPost-demographic dividendPre-demographic dividendQatarRomaniaRussian FederationRwandaSamoaSan MarinoSao Tome and PrincipeSaudi ArabiaSenegalSerbiaSeychellesSierra LeoneSlovak RepublicSloveniaSmall statesSolomon IslandsSouth AfricaSouth AsiaSouth Asia (IDA & IBRD)South SudanSpainSri LankaSt. Kitts and NevisSt. LuciaSt. Vincent and the GrenadinesSub-Saharan Africa Sub-Saharan Africa (excluding high income)Sub-Saharan Africa (IDA & IBRD countries)SudanSurinameSwazilandSwedenSwitzerlandSyrian Arab RepublicTajikistanTanzaniaThailandTimor-LesteTogoTongaTrinidad and TobagoTunisiaTurkeyTuvaluUgandaUkraineUnited Arab EmiratesUpper middle incomeUruguayUzbekistanVanuatuVenezuela, RBVietnamWest Bank and GazaWorldYemen, Rep.ZambiaZimbabwe Timeline:
This timeline shows a graph from 1971 to 2014 of Swaziland. No data until 1970. Number of actual observations by date: 41.
Source name:
World Development Indicators
Source organization:
United Nations Educational, Scientific, and Cultural Organization (UNESCO) Institute for Statistics.
Categories, topics:
Education
Last updated:
apr 23, 2017
Indicators value changes by year
Minimum:
12.598
jan 1, 1971
Maximum:
49.905
jan 1, 2014
At the date of observation
Value
Absolute change
Change from previous value
jan 1, 1971
12.598
+12.598
0.0%
jan 1, 1972
12.853
+0.256
2.03%
jan 1, 1973
15.004
+2.15
16.73%
jan 1, 1974
17.843
+2.84
18.93%
jan 1, 1975
20.604
+2.761
15.47%
jan 1, 1976
22.406
+1.802
8.75%
jan 1, 1977
24.174
+1.767
7.89%
jan 1, 1978
28.813
+4.639
19.19%
jan 1, 1979
31.89
+3.077
10.68%
jan 1, 1980
31.732
-0.157
-0.49%
jan 1, 1981
32.956
+1.224
3.86%
jan 1, 1982
32.567
-0.389
-1.18%
jan 1, 1983
34.715
+2.147
6.59%
jan 1, 1984
35.665
+0.95
2.74%
jan 1, 1985
33.403
-2.261
-6.34%
jan 1, 1986
32.609
-0.795
-2.38%
jan 1, 1987
30.961
-1.648
-5.05%
jan 1, 1988
30.639
-0.322
-1.04%
jan 1, 1989
30.154
-0.486
-1.59%
jan 1, 1990
36.39
+6.237
20.68%
jan 1, 1991
31.871
-4.52
-12.42%
jan 1, 1992
37.019
+5.148
16.15%
jan 1, 1993
41.779
+4.761
12.86%
jan 1, 1994
39.172
-2.607
-6.24%
jan 1, 1995
39.278
+0.106
0.27%
jan 1, 1996
39.572
+0.294
0.75%
jan 1, 1999
39.267
-0.306
-0.77%
jan 1, 2000
33.439
-5.828
-14.84%
jan 1, 2001
31.673
-1.766
-5.28%
jan 1, 2002
35.321
+3.648
11.52%
jan 1, 2003
32.822
-2.499
-7.07%
jan 1, 2004
32.306
-0.516
-1.57%
jan 1, 2005
33.302
+0.996
3.08%
jan 1, 2006
36.726
+3.424
10.28%
jan 1, 2007
41.225
+4.499
12.25%
jan 1, 2008
42.742
+1.517
3.68%
jan 1, 2010
43.996
+1.254
2.93%
jan 1, 2011
46.274
+2.278
5.18%
jan 1, 2012
42.104
-4.17
-9.01%
jan 1, 2013
45.473
+3.369
8.0%
jan 1, 2014
49.905
+4.432
9.75%
Ranking of countries by current statistics by years


Comments: