29
/
en
AIzaSyAYiBZKx7MnpbEhh9jyipgxe19OcubqV5w
April 1, 2024
171919
Kuwait
KWT
true
2
1
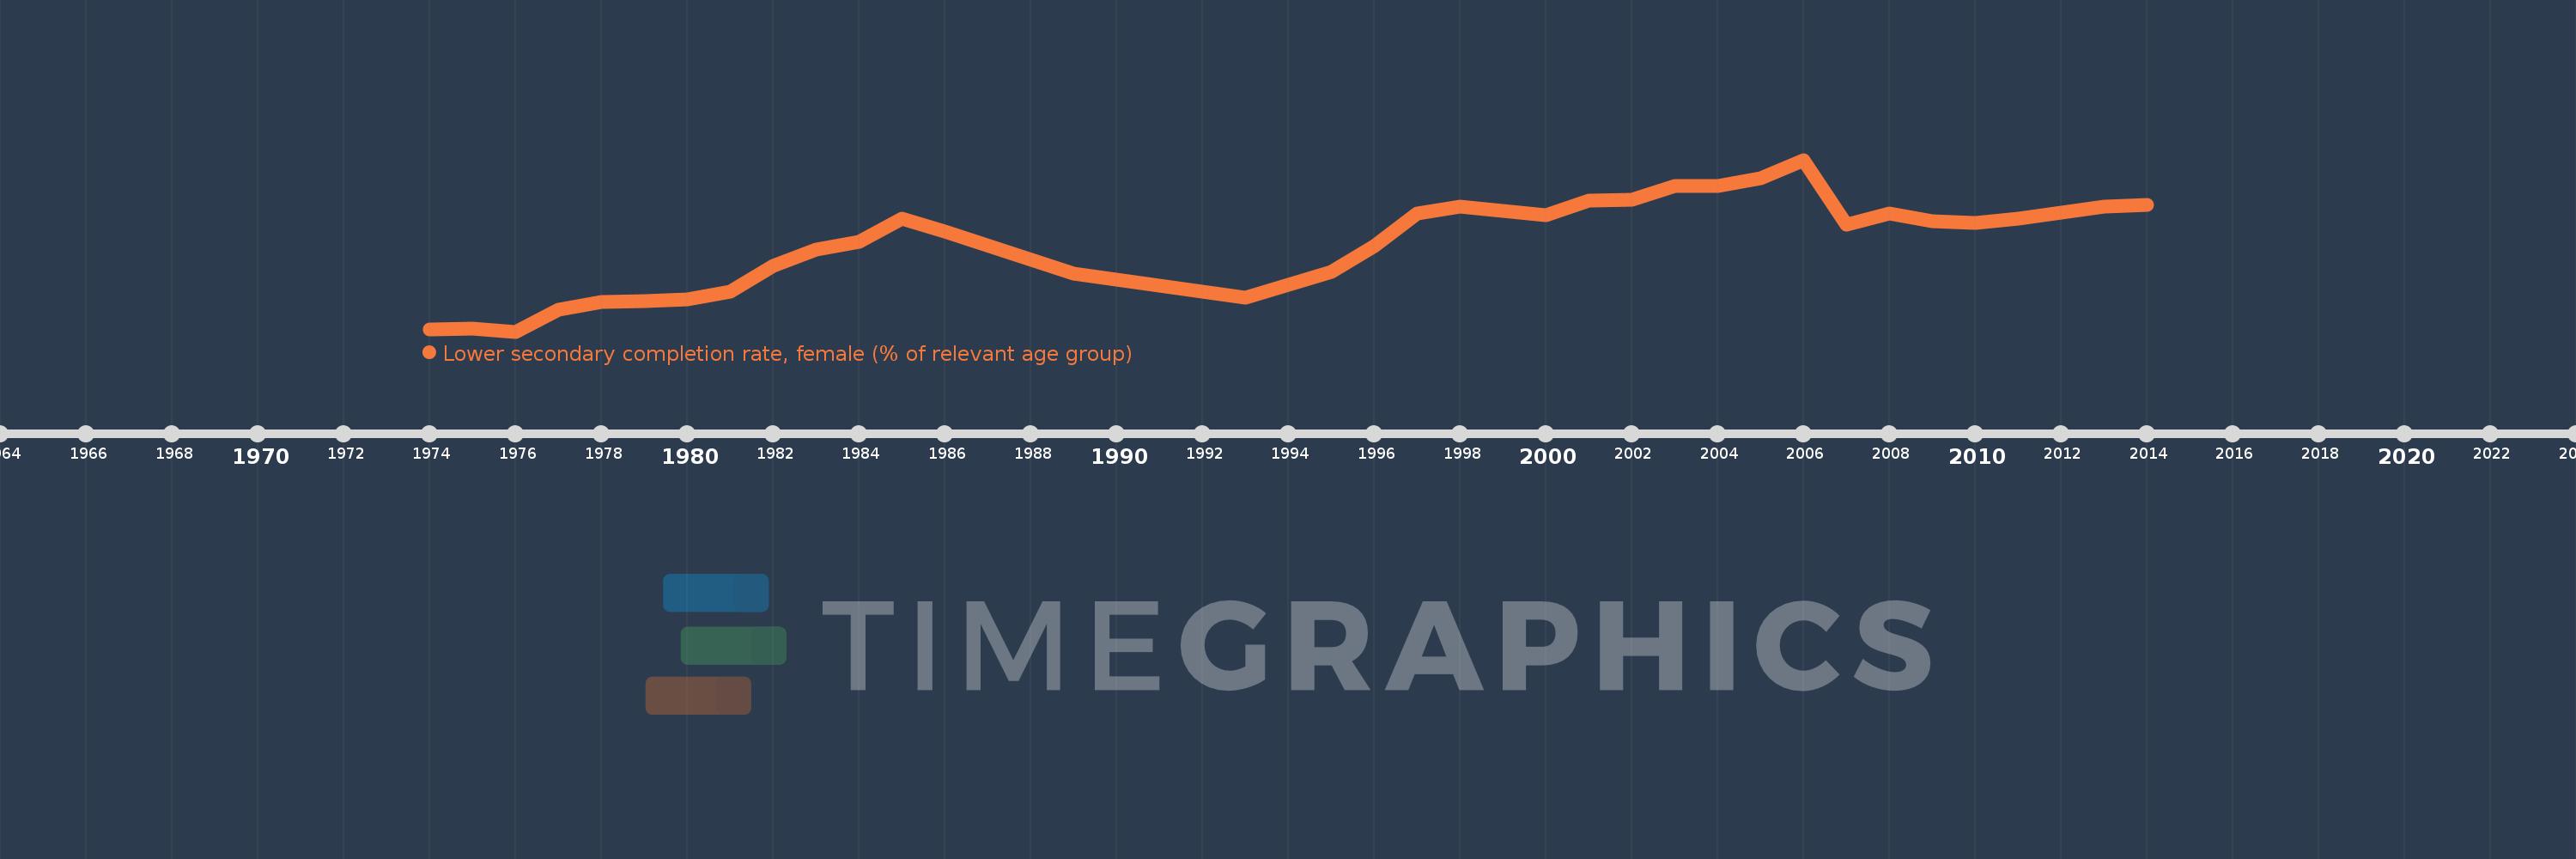
Lower secondary completion rate, female (% of relevant age group)
2014,2013,2011,2010,2009,2008,2007,2006,2005,2004,2003,2002,2001,2000,1998,1997,1996,1995,1993,1989,1986,1985,1984,1983,1982,1981,1980,1979,1978,1977,1976,1975,1974
This statistics in other country:
AfghanistanAlbaniaAlgeriaAngolaAntigua and BarbudaArab WorldArgentinaArmeniaArubaAustriaAzerbaijanBahamas, TheBahrainBangladeshBarbadosBelarusBelgiumBelizeBeninBermudaBhutanBoliviaBosnia and HerzegovinaBotswanaBrunei DarussalamBulgariaBurkina FasoBurundiCabo VerdeCambodiaCameroonCaribbean small statesCentral African RepublicCentral Europe and the BalticsChadChileChinaColombiaComorosCongo, Dem. Rep.Congo, Rep.Costa RicaCote d'IvoireCroatiaCubaCyprusCzech RepublicDenmarkDjiboutiDominicaDominican RepublicEarly-demographic dividendEast Asia & PacificEast Asia & Pacific (excluding high income)East Asia & Pacific (IDA & IBRD countries)EcuadorEgypt, Arab Rep.El SalvadorEquatorial GuineaEritreaEstoniaEthiopiaEuro areaEurope & Central AsiaEurope & Central Asia (excluding high income)Europe & Central Asia (IDA & IBRD countries)European UnionFijiFinlandFragile and conflict affected situationsFranceGabonGambia, TheGeorgiaGermanyGhanaGreeceGrenadaGuatemalaGuineaGuinea-BissauGuyanaHaitiHeavily indebted poor countries (HIPC)High incomeHondurasHong Kong SAR, ChinaHungaryIBRD onlyIcelandIDA & IBRD totalIDA blendIDA onlyIDA totalIndiaIndonesiaIran, Islamic Rep.IraqIrelandIsraelItalyJamaicaJapanJordanKazakhstanKenyaKiribatiKorea, Dem. People’s Rep.Korea, Rep.KuwaitKyrgyz RepublicLao PDRLate-demographic dividendLatin America & Caribbean Latin America & Caribbean (excluding high income)Latin America & the Caribbean (IDA & IBRD countries)LatviaLeast developed countries: UN classificationLebanonLesothoLiberiaLiechtensteinLithuaniaLow & middle incomeLow incomeLower middle incomeLuxembourgMacao SAR, ChinaMacedonia, FYRMadagascarMalawiMaldivesMaliMaltaMarshall IslandsMauritaniaMauritiusMexicoMiddle East & North AfricaMiddle East & North Africa (excluding high income)Middle East & North Africa (IDA & IBRD countries)Middle incomeMoldovaMongoliaMontenegroMoroccoMozambiqueMyanmarNamibiaNauruNepalNetherlandsNicaraguaNigerNorwayOECD membersOmanOther small statesPacific island small statesPakistanPalauPanamaPapua New GuineaParaguayPeruPhilippinesPolandPortugalPost-demographic dividendPre-demographic dividendQatarRomaniaRussian FederationRwandaSamoaSan MarinoSao Tome and PrincipeSaudi ArabiaSenegalSerbiaSeychellesSierra LeoneSlovak RepublicSloveniaSmall statesSolomon IslandsSouth AfricaSouth AsiaSouth Asia (IDA & IBRD)South SudanSpainSri LankaSt. Kitts and NevisSt. LuciaSt. Vincent and the GrenadinesSub-Saharan Africa Sub-Saharan Africa (excluding high income)Sub-Saharan Africa (IDA & IBRD countries)SudanSurinameSwazilandSwedenSwitzerlandSyrian Arab RepublicTajikistanTanzaniaThailandTimor-LesteTogoTongaTrinidad and TobagoTunisiaTurkeyTuvaluUgandaUkraineUnited Arab EmiratesUpper middle incomeUruguayUzbekistanVanuatuVenezuela, RBVietnamWest Bank and GazaWorldYemen, Rep.ZambiaZimbabwe Timeline:
This timeline shows a graph from 1974 to 2014 of Kuwait. No data until 1973. Number of actual observations by date: 33.
Source name:
World Development Indicators
Source organization:
United Nations Educational, Scientific, and Cultural Organization (UNESCO) Institute for Statistics.
Categories, topics:
Education
Last updated:
apr 23, 2017
Indicators value changes by year
Minimum:
39.637
jan 1, 1976
Maximum:
116.418
jan 1, 2006
At the date of observation
Value
Absolute change
Change from previous value
jan 1, 1974
40.574
+40.574
0.0%
jan 1, 1975
41.084
+0.51
1.26%
jan 1, 1976
39.637
-1.447
-3.52%
jan 1, 1977
49.235
+9.598
24.22%
jan 1, 1978
52.899
+3.664
7.44%
jan 1, 1979
53.146
+0.246
0.47%
jan 1, 1980
54.05
+0.904
1.7%
jan 1, 1981
57.639
+3.589
6.64%
jan 1, 1982
68.829
+11.19
19.41%
jan 1, 1983
76.445
+7.616
11.06%
jan 1, 1984
79.677
+3.232
4.23%
jan 1, 1985
90.193
+10.516
13.2%
jan 1, 1986
84.348
-5.845
-6.48%
jan 1, 1989
65.4
-18.948
-22.46%
jan 1, 1993
54.884
-10.517
-16.08%
jan 1, 1995
66.48
+11.596
21.13%
jan 1, 1996
78.018
+11.538
17.36%
jan 1, 1997
92.494
+14.477
18.56%
jan 1, 1998
95.563
+3.069
3.32%
jan 1, 2000
91.487
-4.076
-4.27%
jan 1, 2001
98.205
+6.718
7.34%
jan 1, 2002
98.472
+0.267
0.27%
jan 1, 2003
104.517
+6.045
6.14%
jan 1, 2004
104.826
+0.309
0.3%
jan 1, 2005
107.996
+3.17
3.02%
jan 1, 2006
116.418
+8.422
7.8%
jan 1, 2007
87.313
-29.105
-25.0%
jan 1, 2008
92.318
+5.005
5.73%
jan 1, 2009
88.953
-3.365
-3.65%
jan 1, 2010
88.202
-0.751
-0.84%
jan 1, 2011
90.142
+1.94
2.2%
jan 1, 2013
95.321
+5.179
5.74%
jan 1, 2014
96.31
+0.99
1.04%
Ranking of countries by current statistics by years


Comments: