29
/
en
AIzaSyAYiBZKx7MnpbEhh9jyipgxe19OcubqV5w
April 1, 2024
96360
Burundi
BDI
true
2
1
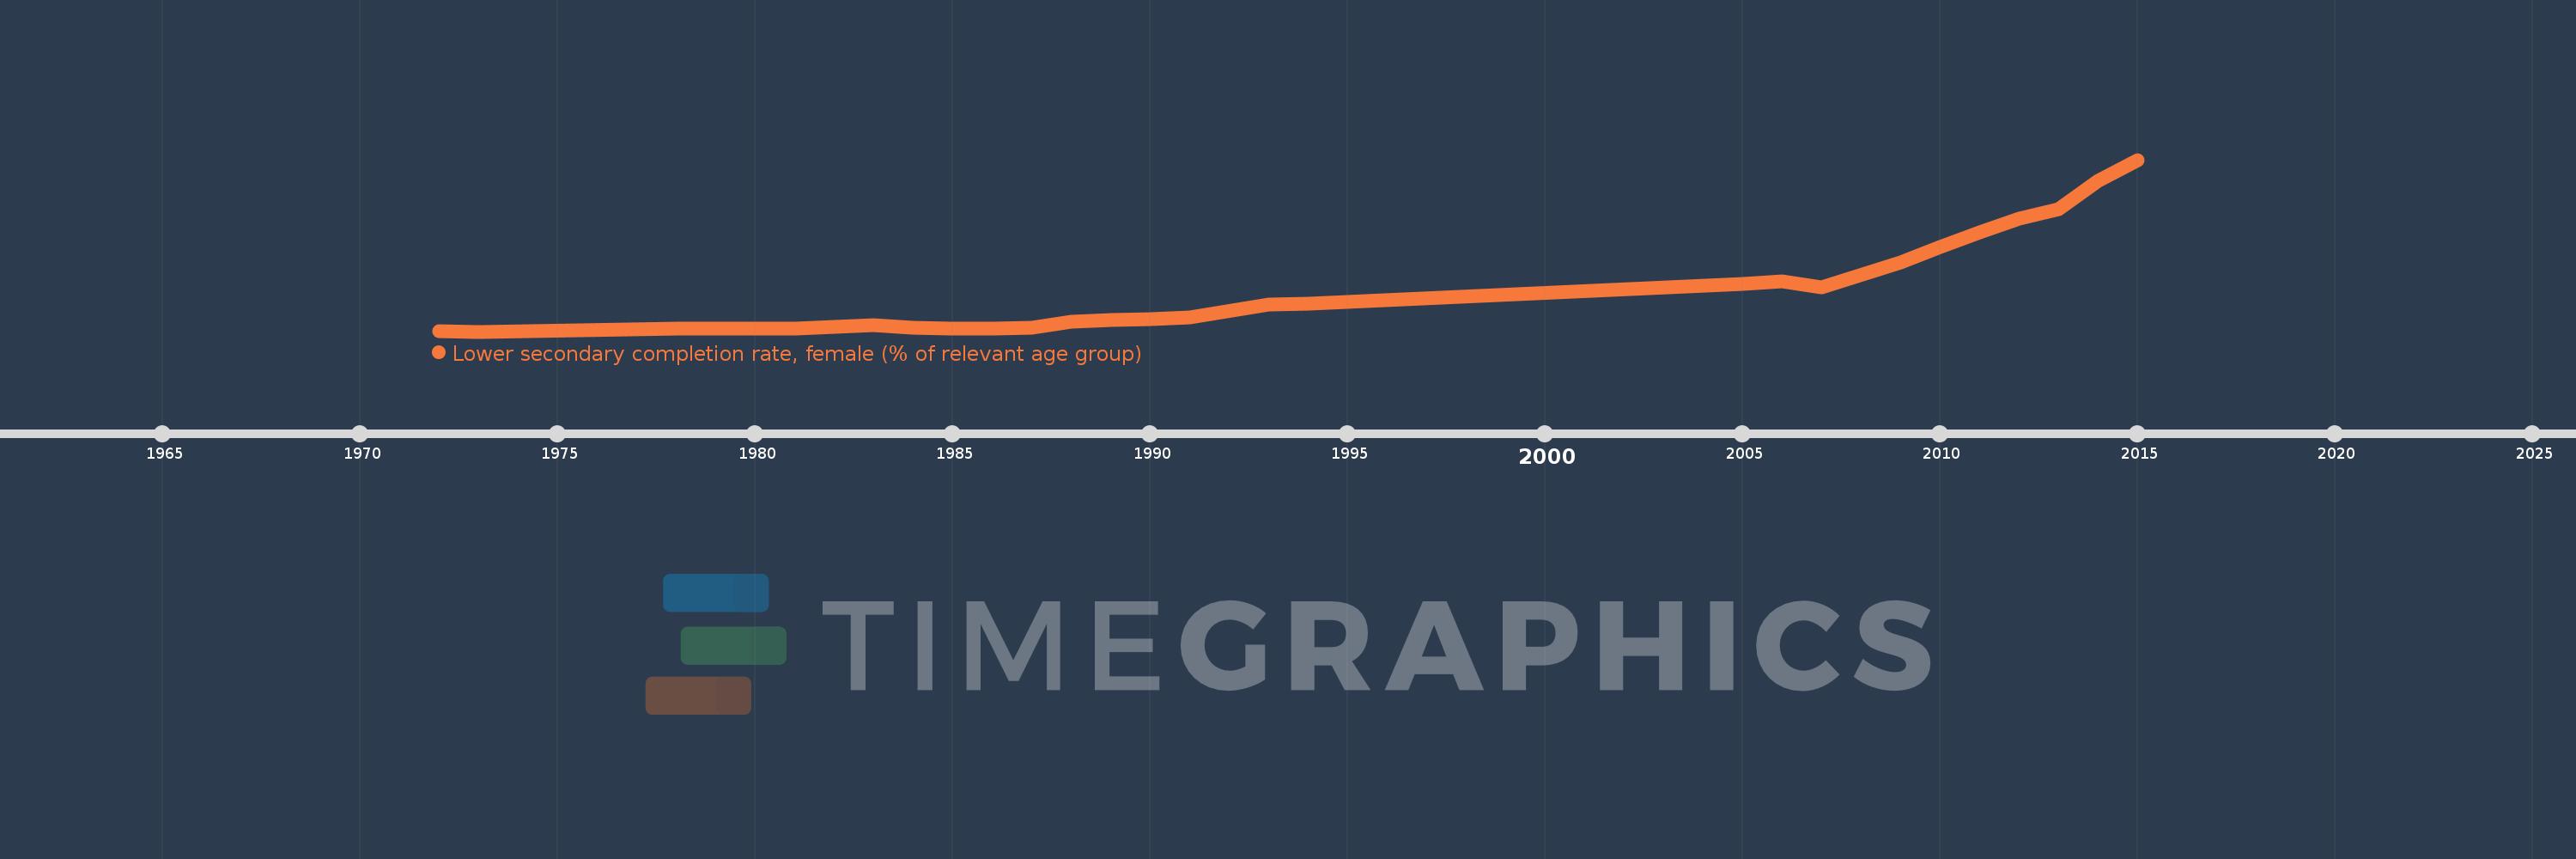
Lower secondary completion rate, female (% of relevant age group)
2015,2014,2013,2012,2011,2010,2009,2007,2006,2005,1994,1993,1991,1990,1989,1988,1987,1986,1985,1984,1983,1982,1981,1980,1979,1978,1973,1972
This statistics in other country:
AfghanistanAlbaniaAlgeriaAngolaAntigua and BarbudaArab WorldArgentinaArmeniaArubaAustriaAzerbaijanBahamas, TheBahrainBangladeshBarbadosBelarusBelgiumBelizeBeninBermudaBhutanBoliviaBosnia and HerzegovinaBotswanaBrunei DarussalamBulgariaBurkina FasoBurundiCabo VerdeCambodiaCameroonCaribbean small statesCentral African RepublicCentral Europe and the BalticsChadChileChinaColombiaComorosCongo, Dem. Rep.Congo, Rep.Costa RicaCote d'IvoireCroatiaCubaCyprusCzech RepublicDenmarkDjiboutiDominicaDominican RepublicEarly-demographic dividendEast Asia & PacificEast Asia & Pacific (excluding high income)East Asia & Pacific (IDA & IBRD countries)EcuadorEgypt, Arab Rep.El SalvadorEquatorial GuineaEritreaEstoniaEthiopiaEuro areaEurope & Central AsiaEurope & Central Asia (excluding high income)Europe & Central Asia (IDA & IBRD countries)European UnionFijiFinlandFragile and conflict affected situationsFranceGabonGambia, TheGeorgiaGermanyGhanaGreeceGrenadaGuatemalaGuineaGuinea-BissauGuyanaHaitiHeavily indebted poor countries (HIPC)High incomeHondurasHong Kong SAR, ChinaHungaryIBRD onlyIcelandIDA & IBRD totalIDA blendIDA onlyIDA totalIndiaIndonesiaIran, Islamic Rep.IraqIrelandIsraelItalyJamaicaJapanJordanKazakhstanKenyaKiribatiKorea, Dem. People’s Rep.Korea, Rep.KuwaitKyrgyz RepublicLao PDRLate-demographic dividendLatin America & Caribbean Latin America & Caribbean (excluding high income)Latin America & the Caribbean (IDA & IBRD countries)LatviaLeast developed countries: UN classificationLebanonLesothoLiberiaLiechtensteinLithuaniaLow & middle incomeLow incomeLower middle incomeLuxembourgMacao SAR, ChinaMacedonia, FYRMadagascarMalawiMaldivesMaliMaltaMarshall IslandsMauritaniaMauritiusMexicoMiddle East & North AfricaMiddle East & North Africa (excluding high income)Middle East & North Africa (IDA & IBRD countries)Middle incomeMoldovaMongoliaMontenegroMoroccoMozambiqueMyanmarNamibiaNauruNepalNetherlandsNicaraguaNigerNorwayOECD membersOmanOther small statesPacific island small statesPakistanPalauPanamaPapua New GuineaParaguayPeruPhilippinesPolandPortugalPost-demographic dividendPre-demographic dividendQatarRomaniaRussian FederationRwandaSamoaSan MarinoSao Tome and PrincipeSaudi ArabiaSenegalSerbiaSeychellesSierra LeoneSlovak RepublicSloveniaSmall statesSolomon IslandsSouth AfricaSouth AsiaSouth Asia (IDA & IBRD)South SudanSpainSri LankaSt. Kitts and NevisSt. LuciaSt. Vincent and the GrenadinesSub-Saharan Africa Sub-Saharan Africa (excluding high income)Sub-Saharan Africa (IDA & IBRD countries)SudanSurinameSwazilandSwedenSwitzerlandSyrian Arab RepublicTajikistanTanzaniaThailandTimor-LesteTogoTongaTrinidad and TobagoTunisiaTurkeyTuvaluUgandaUkraineUnited Arab EmiratesUpper middle incomeUruguayUzbekistanVanuatuVenezuela, RBVietnamWest Bank and GazaWorldYemen, Rep.ZambiaZimbabwe Timeline:
This timeline shows a graph from 1972 to 2015 of Burundi. No data until 1971. Number of actual observations by date: 28.
Source name:
World Development Indicators
Source organization:
United Nations Educational, Scientific, and Cultural Organization (UNESCO) Institute for Statistics.
Categories, topics:
Education
Last updated:
apr 23, 2017
Indicators value changes by year
Maximum:
22.769
jan 1, 2015
At the date of observation
Value
Absolute change
Change from previous value
jan 1, 1972
0.242
+0.242
0.0%
jan 1, 1973
0.227
-0.015
-6.16%
jan 1, 1978
0.632
+0.405
178.31%
jan 1, 1979
0.606
-0.026
-4.18%
jan 1, 1980
0.594
-0.012
-1.95%
jan 1, 1981
0.61
+0.016
2.63%
jan 1, 1982
0.862
+0.253
41.42%
jan 1, 1983
1.1
+0.238
27.55%
jan 1, 1984
0.722
-0.378
-34.34%
jan 1, 1985
0.614
-0.108
-14.96%
jan 1, 1986
0.665
+0.051
8.24%
jan 1, 1987
0.778
+0.114
17.1%
jan 1, 1988
1.545
+0.767
98.51%
jan 1, 1989
1.73
+0.185
11.99%
jan 1, 1990
1.825
+0.094
5.45%
jan 1, 1991
2.102
+0.277
15.21%
jan 1, 1993
3.722
+1.62
77.08%
jan 1, 1994
3.894
+0.171
4.61%
jan 1, 2005
6.428
+2.534
65.08%
jan 1, 2006
6.838
+0.41
6.38%
jan 1, 2007
6.02
-0.818
-11.96%
jan 1, 2009
9.293
+3.273
54.36%
jan 1, 2010
11.347
+2.055
22.11%
jan 1, 2011
13.199
+1.851
16.32%
jan 1, 2012
15.002
+1.803
13.66%
jan 1, 2013
16.34
+1.338
8.92%
jan 1, 2014
20.048
+3.708
22.69%
jan 1, 2015
22.769
+2.722
13.58%
Ranking of countries by current statistics by years


Comments: