29
/
en
AIzaSyAYiBZKx7MnpbEhh9jyipgxe19OcubqV5w
April 1, 2024
55685
Pre-demographic dividend
PRE
false
2
1
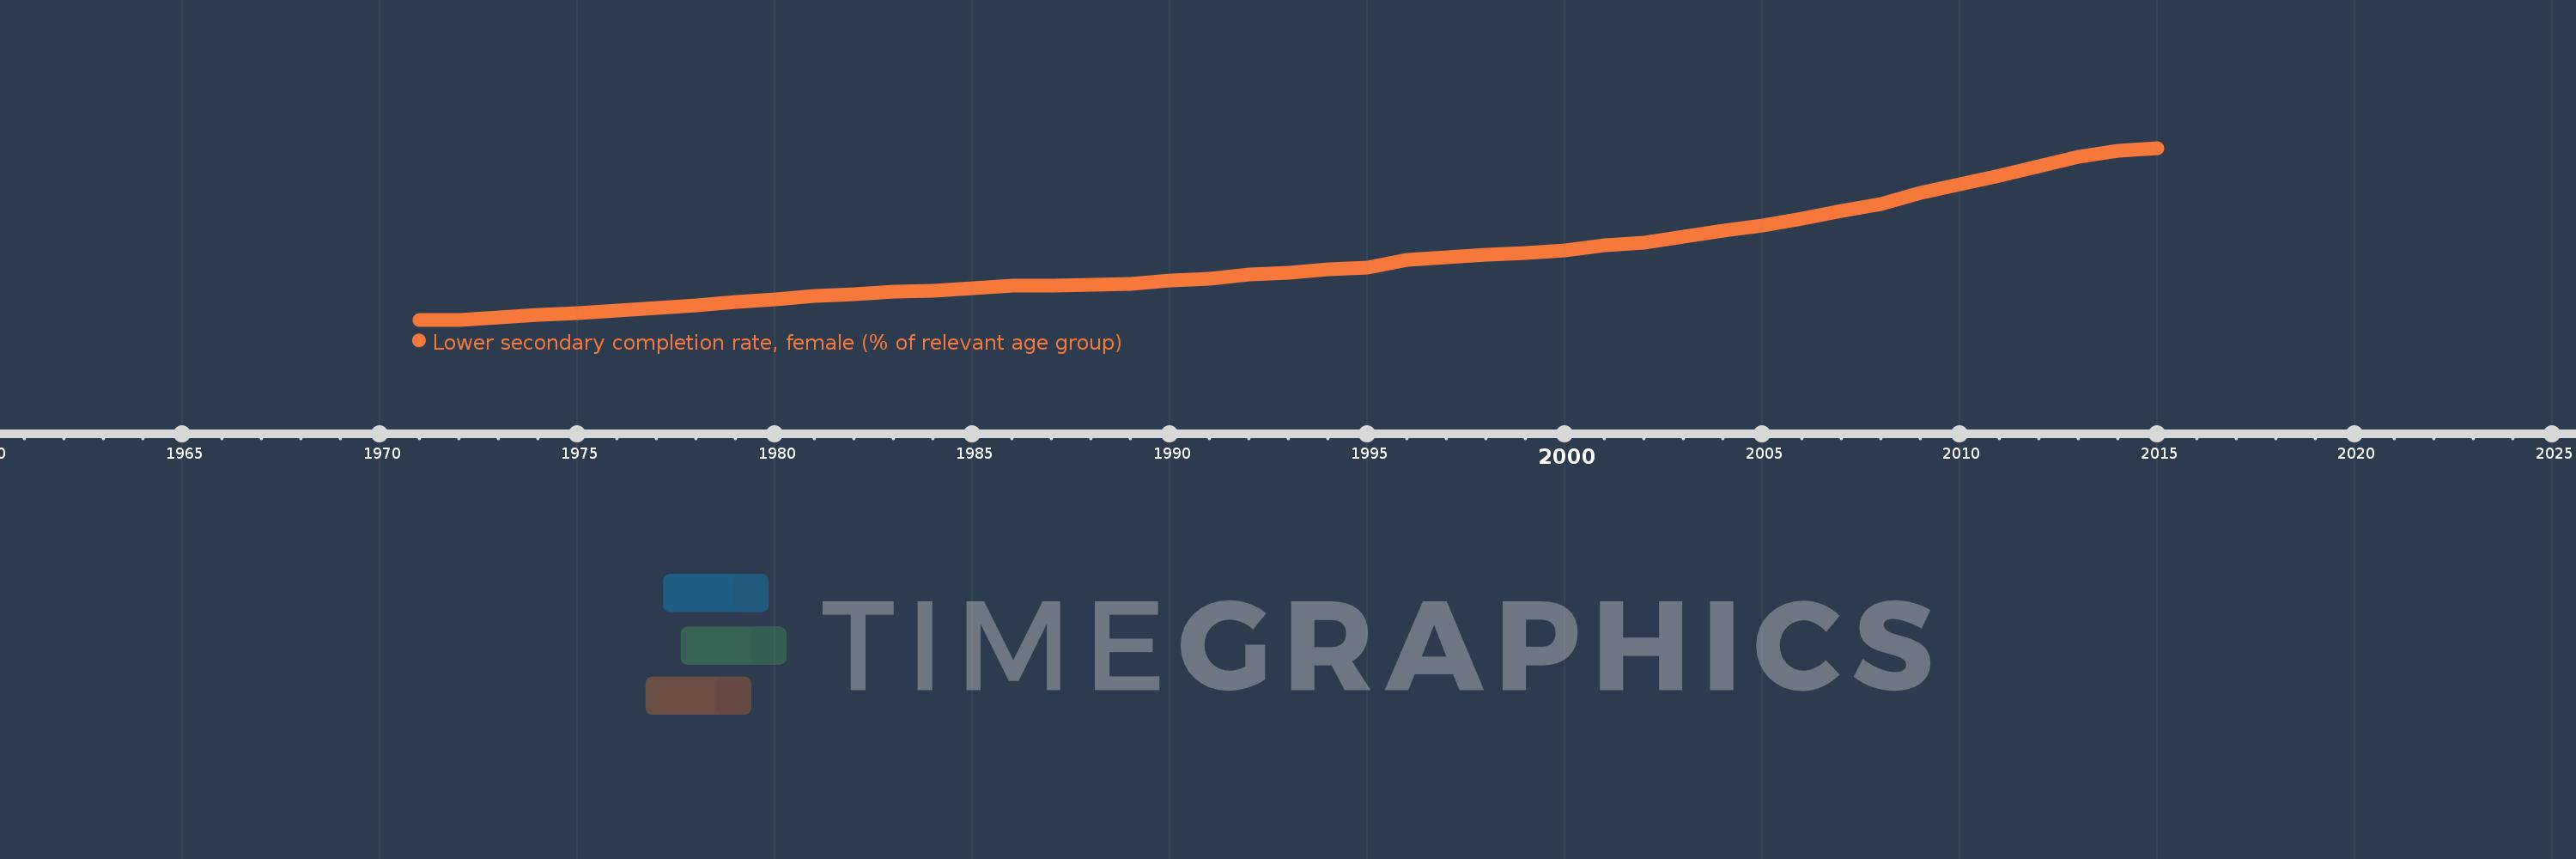
Lower secondary completion rate, female (% of relevant age group)
2015,2014,2013,2012,2011,2010,2009,2008,2007,2006,2005,2004,2003,2002,2001,2000,1999,1998,1997,1996,1995,1994,1993,1992,1991,1990,1989,1988,1987,1986,1985,1984,1983,1982,1981,1980,1979,1978,1977,1976,1975,1974,1973,1972,1971
This statistics in other country:
AfghanistanAlbaniaAlgeriaAngolaAntigua and BarbudaArab WorldArgentinaArmeniaArubaAustriaAzerbaijanBahamas, TheBahrainBangladeshBarbadosBelarusBelgiumBelizeBeninBermudaBhutanBoliviaBosnia and HerzegovinaBotswanaBrunei DarussalamBulgariaBurkina FasoBurundiCabo VerdeCambodiaCameroonCaribbean small statesCentral African RepublicCentral Europe and the BalticsChadChileChinaColombiaComorosCongo, Dem. Rep.Congo, Rep.Costa RicaCote d'IvoireCroatiaCubaCyprusCzech RepublicDenmarkDjiboutiDominicaDominican RepublicEarly-demographic dividendEast Asia & PacificEast Asia & Pacific (excluding high income)East Asia & Pacific (IDA & IBRD countries)EcuadorEgypt, Arab Rep.El SalvadorEquatorial GuineaEritreaEstoniaEthiopiaEuro areaEurope & Central AsiaEurope & Central Asia (excluding high income)Europe & Central Asia (IDA & IBRD countries)European UnionFijiFinlandFragile and conflict affected situationsFranceGabonGambia, TheGeorgiaGermanyGhanaGreeceGrenadaGuatemalaGuineaGuinea-BissauGuyanaHaitiHeavily indebted poor countries (HIPC)High incomeHondurasHong Kong SAR, ChinaHungaryIBRD onlyIcelandIDA & IBRD totalIDA blendIDA onlyIDA totalIndiaIndonesiaIran, Islamic Rep.IraqIrelandIsraelItalyJamaicaJapanJordanKazakhstanKenyaKiribatiKorea, Dem. People’s Rep.Korea, Rep.KuwaitKyrgyz RepublicLao PDRLate-demographic dividendLatin America & Caribbean Latin America & Caribbean (excluding high income)Latin America & the Caribbean (IDA & IBRD countries)LatviaLeast developed countries: UN classificationLebanonLesothoLiberiaLiechtensteinLithuaniaLow & middle incomeLow incomeLower middle incomeLuxembourgMacao SAR, ChinaMacedonia, FYRMadagascarMalawiMaldivesMaliMaltaMarshall IslandsMauritaniaMauritiusMexicoMiddle East & North AfricaMiddle East & North Africa (excluding high income)Middle East & North Africa (IDA & IBRD countries)Middle incomeMoldovaMongoliaMontenegroMoroccoMozambiqueMyanmarNamibiaNauruNepalNetherlandsNicaraguaNigerNorwayOECD membersOmanOther small statesPacific island small statesPakistanPalauPanamaPapua New GuineaParaguayPeruPhilippinesPolandPortugalPost-demographic dividendPre-demographic dividendQatarRomaniaRussian FederationRwandaSamoaSan MarinoSao Tome and PrincipeSaudi ArabiaSenegalSerbiaSeychellesSierra LeoneSlovak RepublicSloveniaSmall statesSolomon IslandsSouth AfricaSouth AsiaSouth Asia (IDA & IBRD)South SudanSpainSri LankaSt. Kitts and NevisSt. LuciaSt. Vincent and the GrenadinesSub-Saharan Africa Sub-Saharan Africa (excluding high income)Sub-Saharan Africa (IDA & IBRD countries)SudanSurinameSwazilandSwedenSwitzerlandSyrian Arab RepublicTajikistanTanzaniaThailandTimor-LesteTogoTongaTrinidad and TobagoTunisiaTurkeyTuvaluUgandaUkraineUnited Arab EmiratesUpper middle incomeUruguayUzbekistanVanuatuVenezuela, RBVietnamWest Bank and GazaWorldYemen, Rep.ZambiaZimbabwe Timeline:
This timeline shows a graph from 1971 to 2015 of Pre-demographic dividend. No data until 1970. Number of actual observations by date: 45.
Source name:
World Development Indicators
Source organization:
United Nations Educational, Scientific, and Cultural Organization (UNESCO) Institute for Statistics.
Categories, topics:
Education
Last updated:
apr 23, 2017
Indicators value changes by year
Maximum:
35.739
jan 1, 2015
At the date of observation
Value
Absolute change
Change from previous value
jan 1, 1971
8.482
+8.482
0.0%
jan 1, 1972
8.466
-0.016
-0.19%
jan 1, 1973
8.884
+0.418
4.94%
jan 1, 1974
9.251
+0.368
4.14%
jan 1, 1975
9.543
+0.292
3.15%
jan 1, 1976
9.928
+0.385
4.04%
jan 1, 1977
10.28
+0.351
3.54%
jan 1, 1978
10.797
+0.517
5.03%
jan 1, 1979
11.225
+0.428
3.96%
jan 1, 1980
11.701
+0.476
4.24%
jan 1, 1981
12.206
+0.505
4.32%
jan 1, 1982
12.491
+0.285
2.34%
jan 1, 1983
12.865
+0.374
2.99%
jan 1, 1984
13.105
+0.24
1.87%
jan 1, 1985
13.489
+0.384
2.93%
jan 1, 1986
13.843
+0.355
2.63%
jan 1, 1987
13.92
+0.077
0.55%
jan 1, 1988
14.049
+0.129
0.93%
jan 1, 1989
14.208
+0.159
1.13%
jan 1, 1990
14.722
+0.514
3.62%
jan 1, 1991
15.032
+0.31
2.11%
jan 1, 1992
15.66
+0.628
4.18%
jan 1, 1993
15.895
+0.235
1.5%
jan 1, 1994
16.534
+0.64
4.02%
jan 1, 1995
16.81
+0.276
1.67%
jan 1, 1996
17.923
+1.113
6.62%
jan 1, 1997
18.348
+0.425
2.37%
jan 1, 1998
18.732
+0.384
2.09%
jan 1, 1999
19.08
+0.348
1.86%
jan 1, 2000
19.521
+0.441
2.31%
jan 1, 2001
20.272
+0.751
3.85%
jan 1, 2002
20.702
+0.43
2.12%
jan 1, 2003
21.71
+1.008
4.87%
jan 1, 2004
22.586
+0.876
4.04%
jan 1, 2005
23.423
+0.837
3.71%
jan 1, 2006
24.551
+1.128
4.82%
jan 1, 2007
25.727
+1.176
4.79%
jan 1, 2008
26.796
+1.069
4.15%
jan 1, 2009
28.598
+1.802
6.72%
jan 1, 2010
29.921
+1.323
4.63%
jan 1, 2011
31.323
+1.402
4.68%
jan 1, 2012
32.8
+1.477
4.72%
jan 1, 2013
34.305
+1.505
4.59%
jan 1, 2014
35.242
+0.937
2.73%
jan 1, 2015
35.739
+0.497
1.41%
Ranking of countries by current statistics by years


Comments: