29
/
en
AIzaSyAYiBZKx7MnpbEhh9jyipgxe19OcubqV5w
April 1, 2024
201832
Morocco
MAR
true
2
1
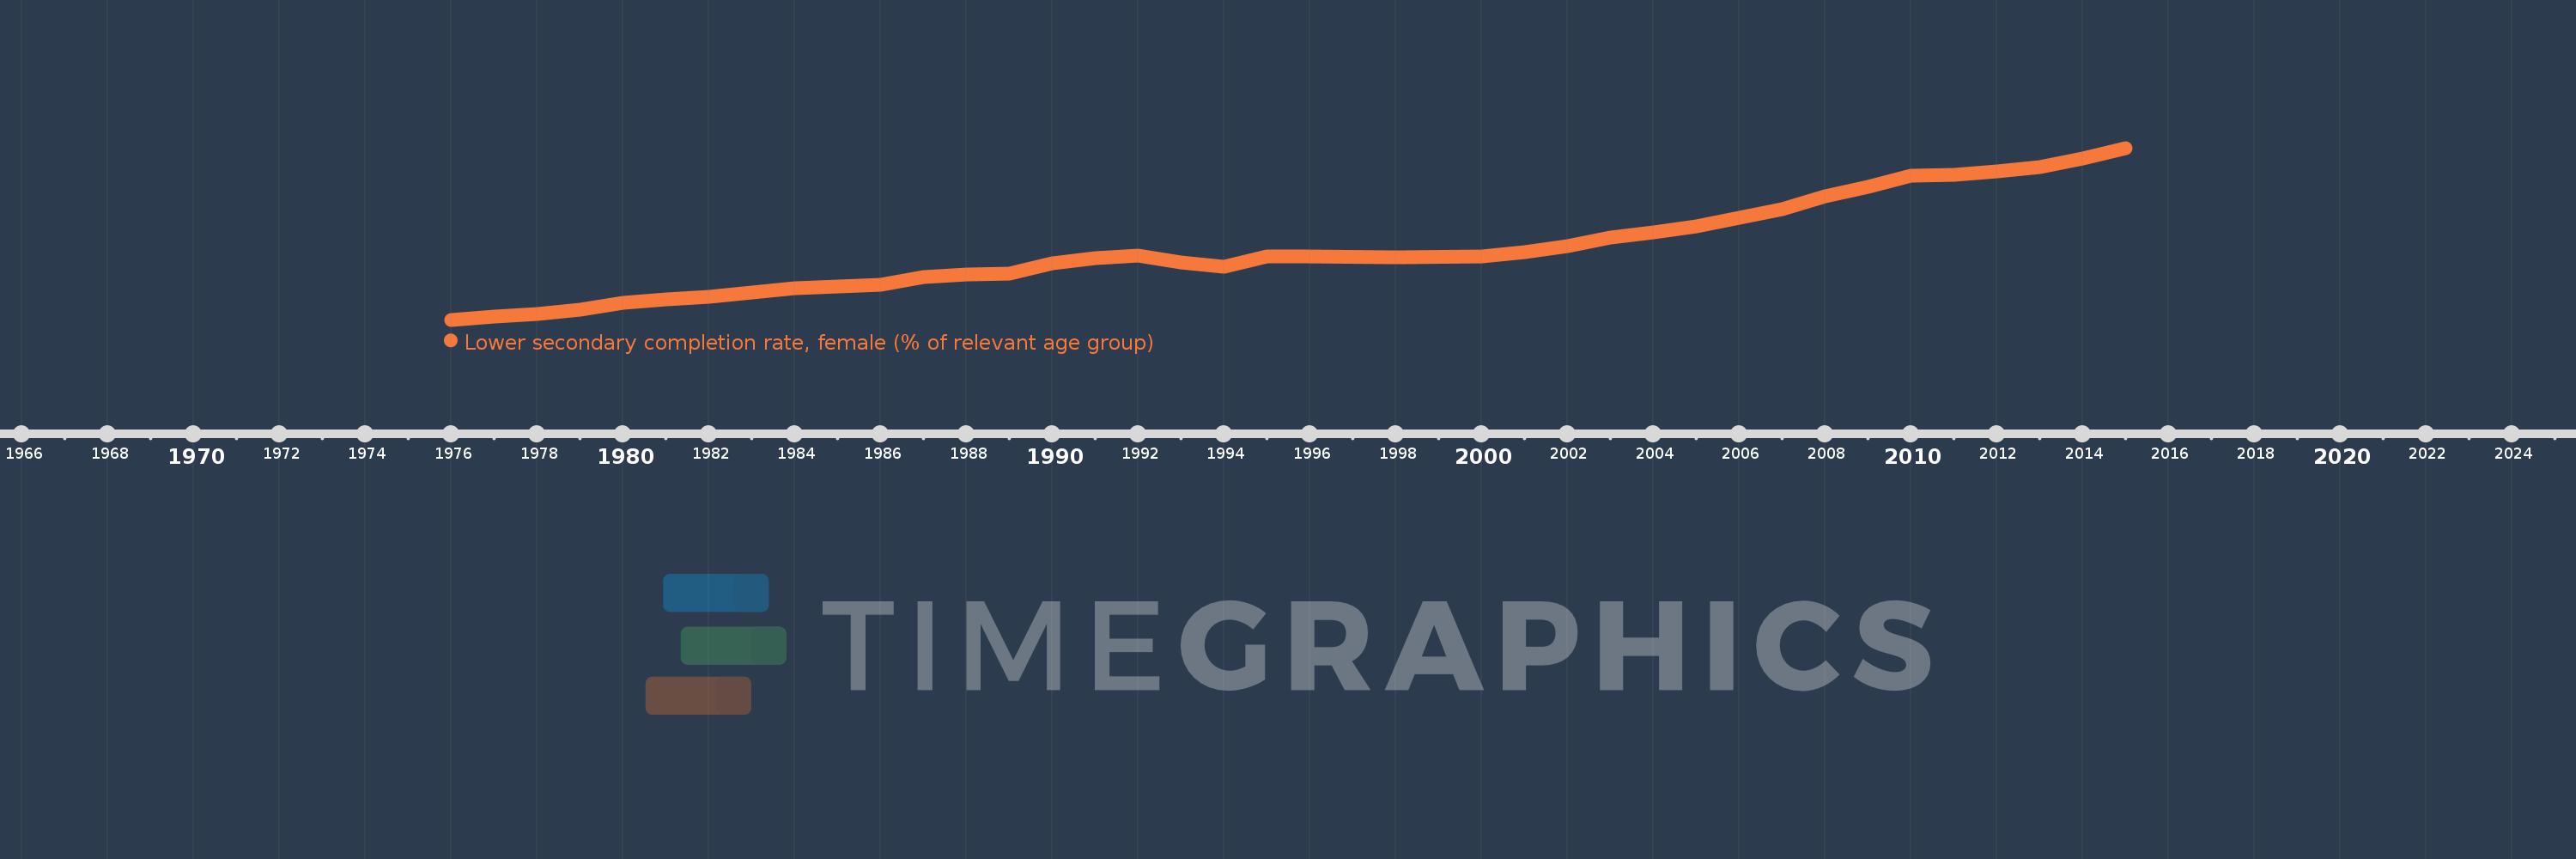
Lower secondary completion rate, female (% of relevant age group)
2015,2014,2013,2012,2011,2010,2009,2008,2007,2005,2004,2003,2002,2001,2000,1998,1996,1995,1994,1993,1992,1991,1990,1989,1988,1987,1986,1984,1982,1981,1980,1979,1978,1977,1976
This statistics in other country:
AfghanistanAlbaniaAlgeriaAngolaAntigua and BarbudaArab WorldArgentinaArmeniaArubaAustriaAzerbaijanBahamas, TheBahrainBangladeshBarbadosBelarusBelgiumBelizeBeninBermudaBhutanBoliviaBosnia and HerzegovinaBotswanaBrunei DarussalamBulgariaBurkina FasoBurundiCabo VerdeCambodiaCameroonCaribbean small statesCentral African RepublicCentral Europe and the BalticsChadChileChinaColombiaComorosCongo, Dem. Rep.Congo, Rep.Costa RicaCote d'IvoireCroatiaCubaCyprusCzech RepublicDenmarkDjiboutiDominicaDominican RepublicEarly-demographic dividendEast Asia & PacificEast Asia & Pacific (excluding high income)East Asia & Pacific (IDA & IBRD countries)EcuadorEgypt, Arab Rep.El SalvadorEquatorial GuineaEritreaEstoniaEthiopiaEuro areaEurope & Central AsiaEurope & Central Asia (excluding high income)Europe & Central Asia (IDA & IBRD countries)European UnionFijiFinlandFragile and conflict affected situationsFranceGabonGambia, TheGeorgiaGermanyGhanaGreeceGrenadaGuatemalaGuineaGuinea-BissauGuyanaHaitiHeavily indebted poor countries (HIPC)High incomeHondurasHong Kong SAR, ChinaHungaryIBRD onlyIcelandIDA & IBRD totalIDA blendIDA onlyIDA totalIndiaIndonesiaIran, Islamic Rep.IraqIrelandIsraelItalyJamaicaJapanJordanKazakhstanKenyaKiribatiKorea, Dem. People’s Rep.Korea, Rep.KuwaitKyrgyz RepublicLao PDRLate-demographic dividendLatin America & Caribbean Latin America & Caribbean (excluding high income)Latin America & the Caribbean (IDA & IBRD countries)LatviaLeast developed countries: UN classificationLebanonLesothoLiberiaLiechtensteinLithuaniaLow & middle incomeLow incomeLower middle incomeLuxembourgMacao SAR, ChinaMacedonia, FYRMadagascarMalawiMaldivesMaliMaltaMarshall IslandsMauritaniaMauritiusMexicoMiddle East & North AfricaMiddle East & North Africa (excluding high income)Middle East & North Africa (IDA & IBRD countries)Middle incomeMoldovaMongoliaMontenegroMoroccoMozambiqueMyanmarNamibiaNauruNepalNetherlandsNicaraguaNigerNorwayOECD membersOmanOther small statesPacific island small statesPakistanPalauPanamaPapua New GuineaParaguayPeruPhilippinesPolandPortugalPost-demographic dividendPre-demographic dividendQatarRomaniaRussian FederationRwandaSamoaSan MarinoSao Tome and PrincipeSaudi ArabiaSenegalSerbiaSeychellesSierra LeoneSlovak RepublicSloveniaSmall statesSolomon IslandsSouth AfricaSouth AsiaSouth Asia (IDA & IBRD)South SudanSpainSri LankaSt. Kitts and NevisSt. LuciaSt. Vincent and the GrenadinesSub-Saharan Africa Sub-Saharan Africa (excluding high income)Sub-Saharan Africa (IDA & IBRD countries)SudanSurinameSwazilandSwedenSwitzerlandSyrian Arab RepublicTajikistanTanzaniaThailandTimor-LesteTogoTongaTrinidad and TobagoTunisiaTurkeyTuvaluUgandaUkraineUnited Arab EmiratesUpper middle incomeUruguayUzbekistanVanuatuVenezuela, RBVietnamWest Bank and GazaWorldYemen, Rep.ZambiaZimbabwe Timeline:
This timeline shows a graph from 1976 to 2015 of Morocco. No data until 1975. Number of actual observations by date: 35.
Source name:
World Development Indicators
Source organization:
United Nations Educational, Scientific, and Cultural Organization (UNESCO) Institute for Statistics.
Categories, topics:
Education
Last updated:
apr 23, 2017
Indicators value changes by year
Maximum:
66.312
jan 1, 2015
At the date of observation
Value
Absolute change
Change from previous value
jan 1, 1976
7.171
+7.171
0.0%
jan 1, 1977
8.179
+1.008
14.06%
jan 1, 1978
9.046
+0.866
10.59%
jan 1, 1979
10.6
+1.554
17.18%
jan 1, 1980
13.049
+2.449
23.11%
jan 1, 1981
14.278
+1.229
9.42%
jan 1, 1982
15.062
+0.784
5.49%
jan 1, 1984
18.067
+3.005
19.95%
jan 1, 1986
19.315
+1.249
6.91%
jan 1, 1987
21.838
+2.523
13.06%
jan 1, 1988
22.644
+0.806
3.69%
jan 1, 1989
22.991
+0.347
1.53%
jan 1, 1990
26.633
+3.642
15.84%
jan 1, 1991
28.355
+1.722
6.46%
jan 1, 1992
29.288
+0.933
3.29%
jan 1, 1993
27.034
-2.253
-7.69%
jan 1, 1994
25.373
-1.662
-6.15%
jan 1, 1995
29.007
+3.634
14.32%
jan 1, 1996
29.103
+0.096
0.33%
jan 1, 1998
28.739
-0.364
-1.25%
jan 1, 2000
28.905
+0.166
0.58%
jan 1, 2001
30.521
+1.616
5.59%
jan 1, 2002
32.595
+2.074
6.79%
jan 1, 2003
35.539
+2.943
9.03%
jan 1, 2004
37.359
+1.821
5.12%
jan 1, 2005
39.261
+1.902
5.09%
jan 1, 2007
45.316
+6.055
15.42%
jan 1, 2008
49.614
+4.298
9.48%
jan 1, 2009
52.824
+3.21
6.47%
jan 1, 2010
56.908
+4.085
7.73%
jan 1, 2011
57.151
+0.243
0.43%
jan 1, 2012
58.191
+1.04
1.82%
jan 1, 2013
59.683
+1.492
2.56%
jan 1, 2014
62.696
+3.012
5.05%
jan 1, 2015
66.312
+3.616
5.77%
Ranking of countries by current statistics by years


Comments: