29
/
en
AIzaSyAYiBZKx7MnpbEhh9jyipgxe19OcubqV5w
April 1, 2024
136972
Gambia, The
GMB
true
2
1
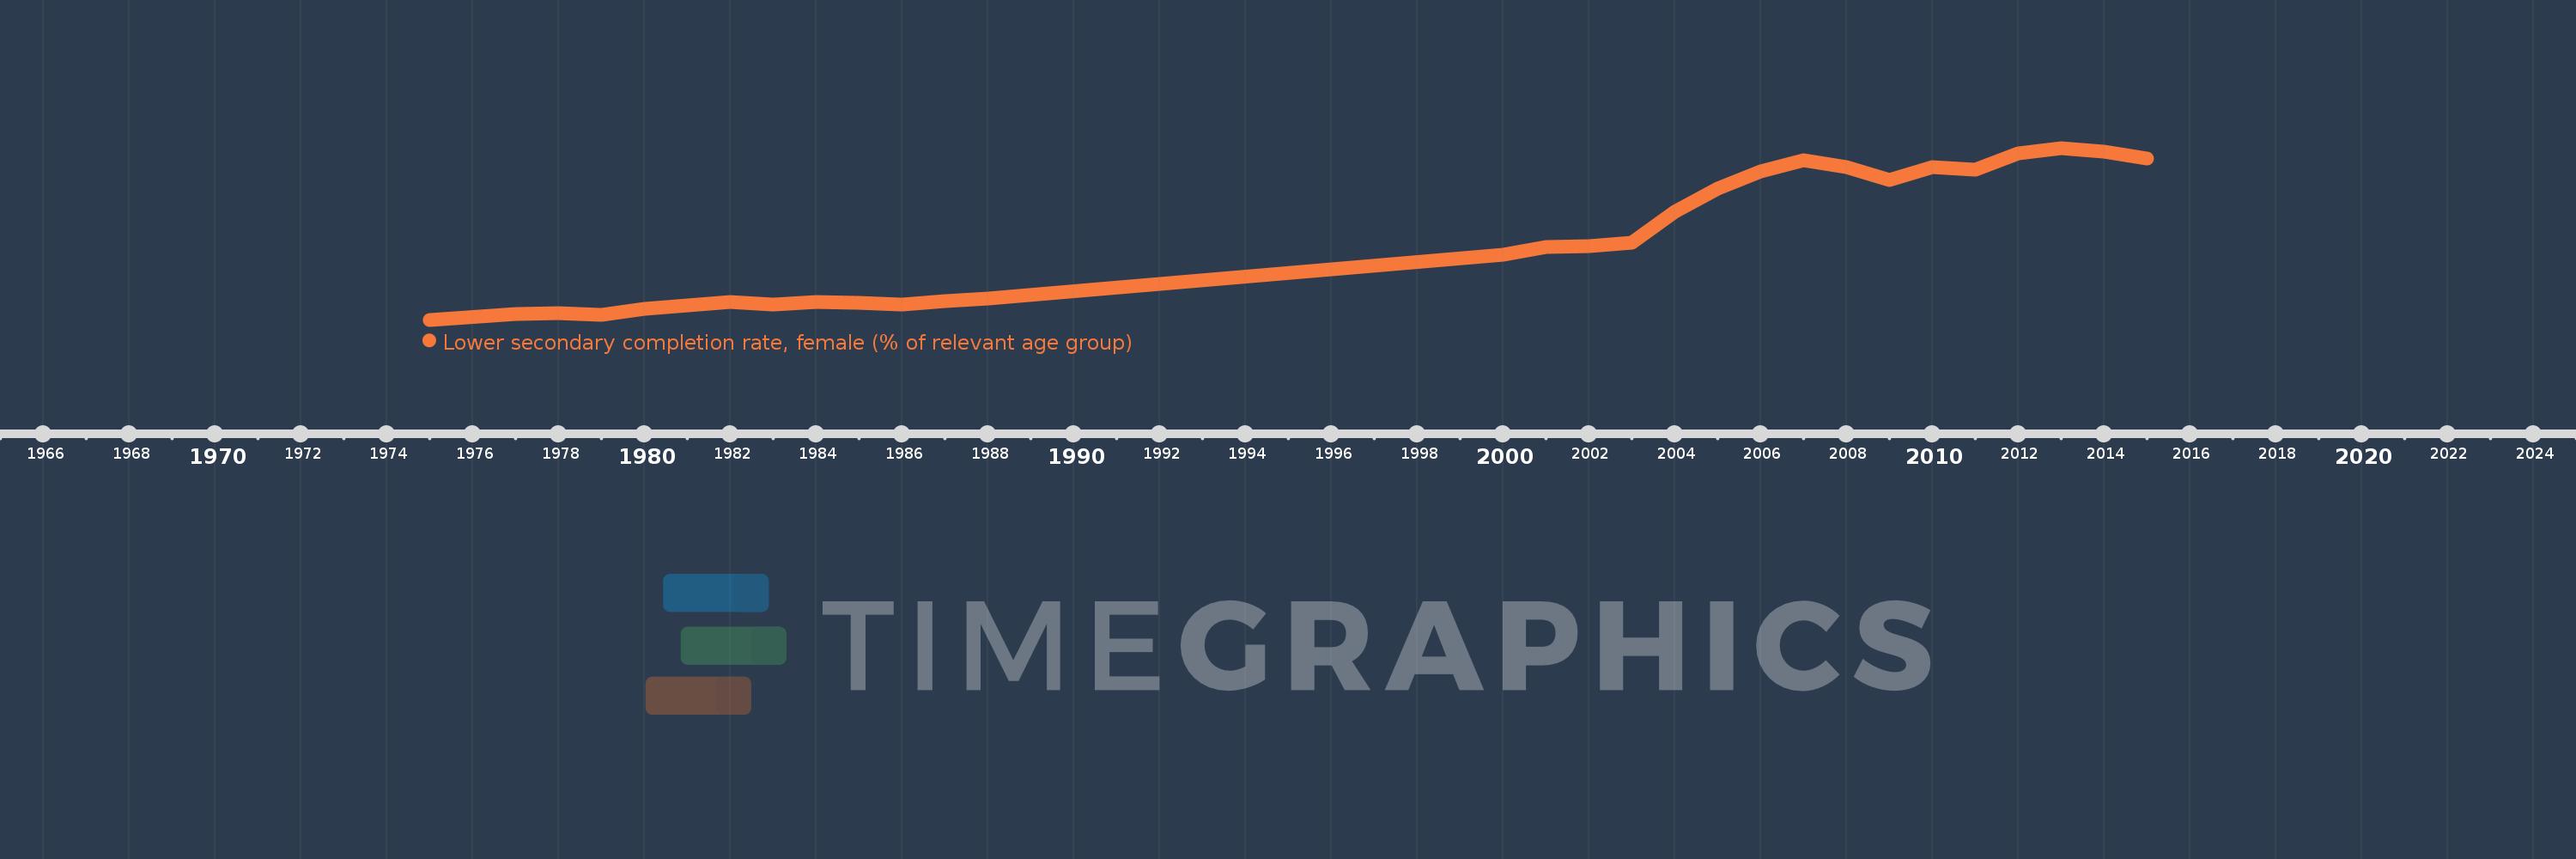
Lower secondary completion rate, female (% of relevant age group)
2015,2014,2013,2012,2011,2010,2009,2008,2007,2006,2005,2004,2003,2002,2001,2000,1988,1987,1986,1985,1984,1983,1982,1981,1980,1979,1978,1977,1975
This statistics in other country:
AfghanistanAlbaniaAlgeriaAngolaAntigua and BarbudaArab WorldArgentinaArmeniaArubaAustriaAzerbaijanBahamas, TheBahrainBangladeshBarbadosBelarusBelgiumBelizeBeninBermudaBhutanBoliviaBosnia and HerzegovinaBotswanaBrunei DarussalamBulgariaBurkina FasoBurundiCabo VerdeCambodiaCameroonCaribbean small statesCentral African RepublicCentral Europe and the BalticsChadChileChinaColombiaComorosCongo, Dem. Rep.Congo, Rep.Costa RicaCote d'IvoireCroatiaCubaCyprusCzech RepublicDenmarkDjiboutiDominicaDominican RepublicEarly-demographic dividendEast Asia & PacificEast Asia & Pacific (excluding high income)East Asia & Pacific (IDA & IBRD countries)EcuadorEgypt, Arab Rep.El SalvadorEquatorial GuineaEritreaEstoniaEthiopiaEuro areaEurope & Central AsiaEurope & Central Asia (excluding high income)Europe & Central Asia (IDA & IBRD countries)European UnionFijiFinlandFragile and conflict affected situationsFranceGabonGambia, TheGeorgiaGermanyGhanaGreeceGrenadaGuatemalaGuineaGuinea-BissauGuyanaHaitiHeavily indebted poor countries (HIPC)High incomeHondurasHong Kong SAR, ChinaHungaryIBRD onlyIcelandIDA & IBRD totalIDA blendIDA onlyIDA totalIndiaIndonesiaIran, Islamic Rep.IraqIrelandIsraelItalyJamaicaJapanJordanKazakhstanKenyaKiribatiKorea, Dem. People’s Rep.Korea, Rep.KuwaitKyrgyz RepublicLao PDRLate-demographic dividendLatin America & Caribbean Latin America & Caribbean (excluding high income)Latin America & the Caribbean (IDA & IBRD countries)LatviaLeast developed countries: UN classificationLebanonLesothoLiberiaLiechtensteinLithuaniaLow & middle incomeLow incomeLower middle incomeLuxembourgMacao SAR, ChinaMacedonia, FYRMadagascarMalawiMaldivesMaliMaltaMarshall IslandsMauritaniaMauritiusMexicoMiddle East & North AfricaMiddle East & North Africa (excluding high income)Middle East & North Africa (IDA & IBRD countries)Middle incomeMoldovaMongoliaMontenegroMoroccoMozambiqueMyanmarNamibiaNauruNepalNetherlandsNicaraguaNigerNorwayOECD membersOmanOther small statesPacific island small statesPakistanPalauPanamaPapua New GuineaParaguayPeruPhilippinesPolandPortugalPost-demographic dividendPre-demographic dividendQatarRomaniaRussian FederationRwandaSamoaSan MarinoSao Tome and PrincipeSaudi ArabiaSenegalSerbiaSeychellesSierra LeoneSlovak RepublicSloveniaSmall statesSolomon IslandsSouth AfricaSouth AsiaSouth Asia (IDA & IBRD)South SudanSpainSri LankaSt. Kitts and NevisSt. LuciaSt. Vincent and the GrenadinesSub-Saharan Africa Sub-Saharan Africa (excluding high income)Sub-Saharan Africa (IDA & IBRD countries)SudanSurinameSwazilandSwedenSwitzerlandSyrian Arab RepublicTajikistanTanzaniaThailandTimor-LesteTogoTongaTrinidad and TobagoTunisiaTurkeyTuvaluUgandaUkraineUnited Arab EmiratesUpper middle incomeUruguayUzbekistanVanuatuVenezuela, RBVietnamWest Bank and GazaWorldYemen, Rep.ZambiaZimbabwe Timeline:
This timeline shows a graph from 1975 to 2015 of Gambia, The. No data until 1974. Number of actual observations by date: 29.
Source name:
World Development Indicators
Source organization:
United Nations Educational, Scientific, and Cultural Organization (UNESCO) Institute for Statistics.
Categories, topics:
Education
Last updated:
apr 23, 2017
Indicators value changes by year
Maximum:
65.583
jan 1, 2013
At the date of observation
Value
Absolute change
Change from previous value
jan 1, 1975
4.496
+4.496
0.0%
jan 1, 1977
6.466
+1.97
43.82%
jan 1, 1978
6.718
+0.252
3.89%
jan 1, 1979
6.175
-0.543
-8.08%
jan 1, 1980
8.426
+2.251
36.46%
jan 1, 1981
9.621
+1.195
14.18%
jan 1, 1982
10.824
+1.203
12.5%
jan 1, 1983
9.797
-1.027
-9.49%
jan 1, 1984
10.824
+1.028
10.49%
jan 1, 1985
10.663
-0.161
-1.49%
jan 1, 1986
9.792
-0.872
-8.18%
jan 1, 1987
10.994
+1.202
12.28%
jan 1, 1988
11.985
+0.991
9.01%
jan 1, 2000
27.767
+15.782
131.69%
jan 1, 2001
30.215
+2.448
8.81%
jan 1, 2002
30.811
+0.596
1.97%
jan 1, 2003
31.891
+1.08
3.51%
jan 1, 2004
42.801
+10.909
34.21%
jan 1, 2005
51.185
+8.384
19.59%
jan 1, 2006
57.244
+6.059
11.84%
jan 1, 2007
61.099
+3.854
6.73%
jan 1, 2008
58.79
-2.309
-3.78%
jan 1, 2009
54.338
-4.452
-7.57%
jan 1, 2010
58.641
+4.303
7.92%
jan 1, 2011
57.962
-0.679
-1.16%
jan 1, 2012
63.662
+5.7
9.83%
jan 1, 2013
65.583
+1.921
3.02%
jan 1, 2014
64.295
-1.288
-1.96%
jan 1, 2015
61.887
-2.408
-3.74%
Ranking of countries by current statistics by years


Comments: