29
/
en
AIzaSyAYiBZKx7MnpbEhh9jyipgxe19OcubqV5w
April 1, 2024
49194
Middle East & North Africa (excluding high income)
MNA
false
2
1
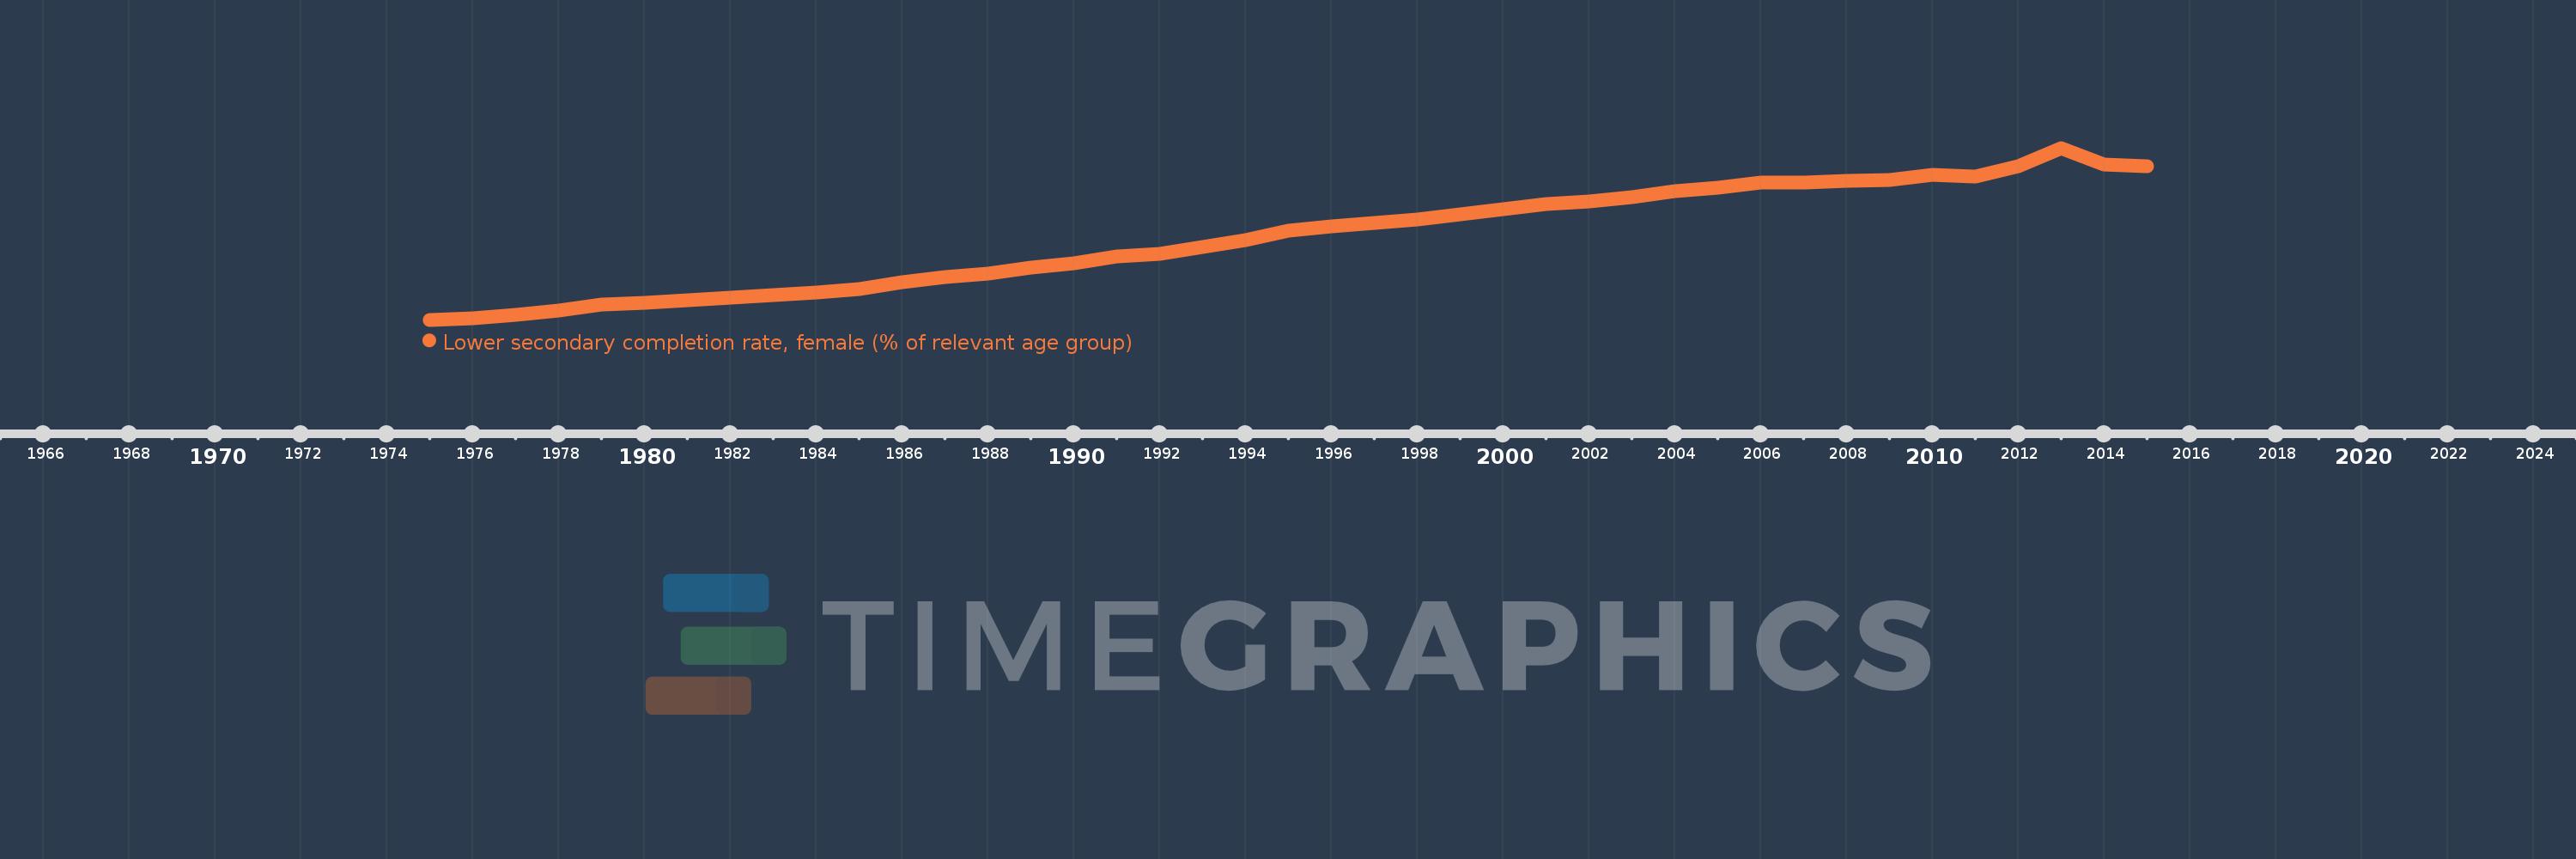
Lower secondary completion rate, female (% of relevant age group)
2015,2014,2013,2012,2011,2010,2009,2008,2007,2006,2005,2004,2003,2002,2001,2000,1999,1998,1997,1996,1995,1994,1993,1992,1991,1990,1989,1988,1987,1986,1985,1984,1983,1982,1981,1980,1979,1978,1977,1976,1975
This statistics in other country:
AfghanistanAlbaniaAlgeriaAngolaAntigua and BarbudaArab WorldArgentinaArmeniaArubaAustriaAzerbaijanBahamas, TheBahrainBangladeshBarbadosBelarusBelgiumBelizeBeninBermudaBhutanBoliviaBosnia and HerzegovinaBotswanaBrunei DarussalamBulgariaBurkina FasoBurundiCabo VerdeCambodiaCameroonCaribbean small statesCentral African RepublicCentral Europe and the BalticsChadChileChinaColombiaComorosCongo, Dem. Rep.Congo, Rep.Costa RicaCote d'IvoireCroatiaCubaCyprusCzech RepublicDenmarkDjiboutiDominicaDominican RepublicEarly-demographic dividendEast Asia & PacificEast Asia & Pacific (excluding high income)East Asia & Pacific (IDA & IBRD countries)EcuadorEgypt, Arab Rep.El SalvadorEquatorial GuineaEritreaEstoniaEthiopiaEuro areaEurope & Central AsiaEurope & Central Asia (excluding high income)Europe & Central Asia (IDA & IBRD countries)European UnionFijiFinlandFragile and conflict affected situationsFranceGabonGambia, TheGeorgiaGermanyGhanaGreeceGrenadaGuatemalaGuineaGuinea-BissauGuyanaHaitiHeavily indebted poor countries (HIPC)High incomeHondurasHong Kong SAR, ChinaHungaryIBRD onlyIcelandIDA & IBRD totalIDA blendIDA onlyIDA totalIndiaIndonesiaIran, Islamic Rep.IraqIrelandIsraelItalyJamaicaJapanJordanKazakhstanKenyaKiribatiKorea, Dem. People’s Rep.Korea, Rep.KuwaitKyrgyz RepublicLao PDRLate-demographic dividendLatin America & Caribbean Latin America & Caribbean (excluding high income)Latin America & the Caribbean (IDA & IBRD countries)LatviaLeast developed countries: UN classificationLebanonLesothoLiberiaLiechtensteinLithuaniaLow & middle incomeLow incomeLower middle incomeLuxembourgMacao SAR, ChinaMacedonia, FYRMadagascarMalawiMaldivesMaliMaltaMarshall IslandsMauritaniaMauritiusMexicoMiddle East & North AfricaMiddle East & North Africa (excluding high income)Middle East & North Africa (IDA & IBRD countries)Middle incomeMoldovaMongoliaMontenegroMoroccoMozambiqueMyanmarNamibiaNauruNepalNetherlandsNicaraguaNigerNorwayOECD membersOmanOther small statesPacific island small statesPakistanPalauPanamaPapua New GuineaParaguayPeruPhilippinesPolandPortugalPost-demographic dividendPre-demographic dividendQatarRomaniaRussian FederationRwandaSamoaSan MarinoSao Tome and PrincipeSaudi ArabiaSenegalSerbiaSeychellesSierra LeoneSlovak RepublicSloveniaSmall statesSolomon IslandsSouth AfricaSouth AsiaSouth Asia (IDA & IBRD)South SudanSpainSri LankaSt. Kitts and NevisSt. LuciaSt. Vincent and the GrenadinesSub-Saharan Africa Sub-Saharan Africa (excluding high income)Sub-Saharan Africa (IDA & IBRD countries)SudanSurinameSwazilandSwedenSwitzerlandSyrian Arab RepublicTajikistanTanzaniaThailandTimor-LesteTogoTongaTrinidad and TobagoTunisiaTurkeyTuvaluUgandaUkraineUnited Arab EmiratesUpper middle incomeUruguayUzbekistanVanuatuVenezuela, RBVietnamWest Bank and GazaWorldYemen, Rep.ZambiaZimbabwe Timeline:
This timeline shows a graph from 1975 to 2015 of Middle East & North Africa (excluding high income). No data until 1974. Number of actual observations by date: 41.
Source name:
World Development Indicators
Source organization:
United Nations Educational, Scientific, and Cultural Organization (UNESCO) Institute for Statistics.
Categories, topics:
Education
Last updated:
apr 23, 2017
Indicators value changes by year
Minimum:
23.027
jan 1, 1975
Maximum:
78.628
jan 1, 2013
At the date of observation
Value
Absolute change
Change from previous value
jan 1, 1975
23.027
+23.027
0.0%
jan 1, 1976
23.62
+0.594
2.58%
jan 1, 1977
24.52
+0.9
3.81%
jan 1, 1978
25.869
+1.349
5.5%
jan 1, 1979
27.894
+2.025
7.83%
jan 1, 1980
28.54
+0.646
2.31%
jan 1, 1981
29.335
+0.795
2.79%
jan 1, 1982
30.148
+0.812
2.77%
jan 1, 1983
30.87
+0.723
2.4%
jan 1, 1984
31.842
+0.971
3.15%
jan 1, 1985
33.087
+1.246
3.91%
jan 1, 1986
35.045
+1.957
5.92%
jan 1, 1987
36.822
+1.777
5.07%
jan 1, 1988
37.939
+1.117
3.03%
jan 1, 1989
39.877
+1.938
5.11%
jan 1, 1990
41.4
+1.522
3.82%
jan 1, 1991
43.577
+2.177
5.26%
jan 1, 1992
44.363
+0.786
1.8%
jan 1, 1993
46.602
+2.239
5.05%
jan 1, 1994
48.711
+2.109
4.52%
jan 1, 1995
51.929
+3.218
6.61%
jan 1, 1996
53.351
+1.422
2.74%
jan 1, 1997
54.491
+1.14
2.14%
jan 1, 1998
55.553
+1.062
1.95%
jan 1, 1999
57.162
+1.608
2.9%
jan 1, 2000
58.76
+1.598
2.8%
jan 1, 2001
60.43
+1.67
2.84%
jan 1, 2002
61.17
+0.741
1.23%
jan 1, 2003
62.609
+1.439
2.35%
jan 1, 2004
64.639
+2.031
3.24%
jan 1, 2005
65.683
+1.043
1.61%
jan 1, 2006
67.39
+1.707
2.6%
jan 1, 2007
67.368
-0.022
-0.03%
jan 1, 2008
67.941
+0.574
0.85%
jan 1, 2009
68.192
+0.251
0.37%
jan 1, 2010
69.983
+1.791
2.63%
jan 1, 2011
69.467
-0.516
-0.74%
jan 1, 2012
72.797
+3.33
4.79%
jan 1, 2013
78.628
+5.831
8.01%
jan 1, 2014
73.194
-5.434
-6.91%
jan 1, 2015
72.684
-0.51
-0.7%
Ranking of countries by current statistics by years


Comments: