29
/
en
AIzaSyAYiBZKx7MnpbEhh9jyipgxe19OcubqV5w
April 1, 2024
60929
Sub-Saharan Africa (IDA & IBRD countries)
TSS
false
2
1
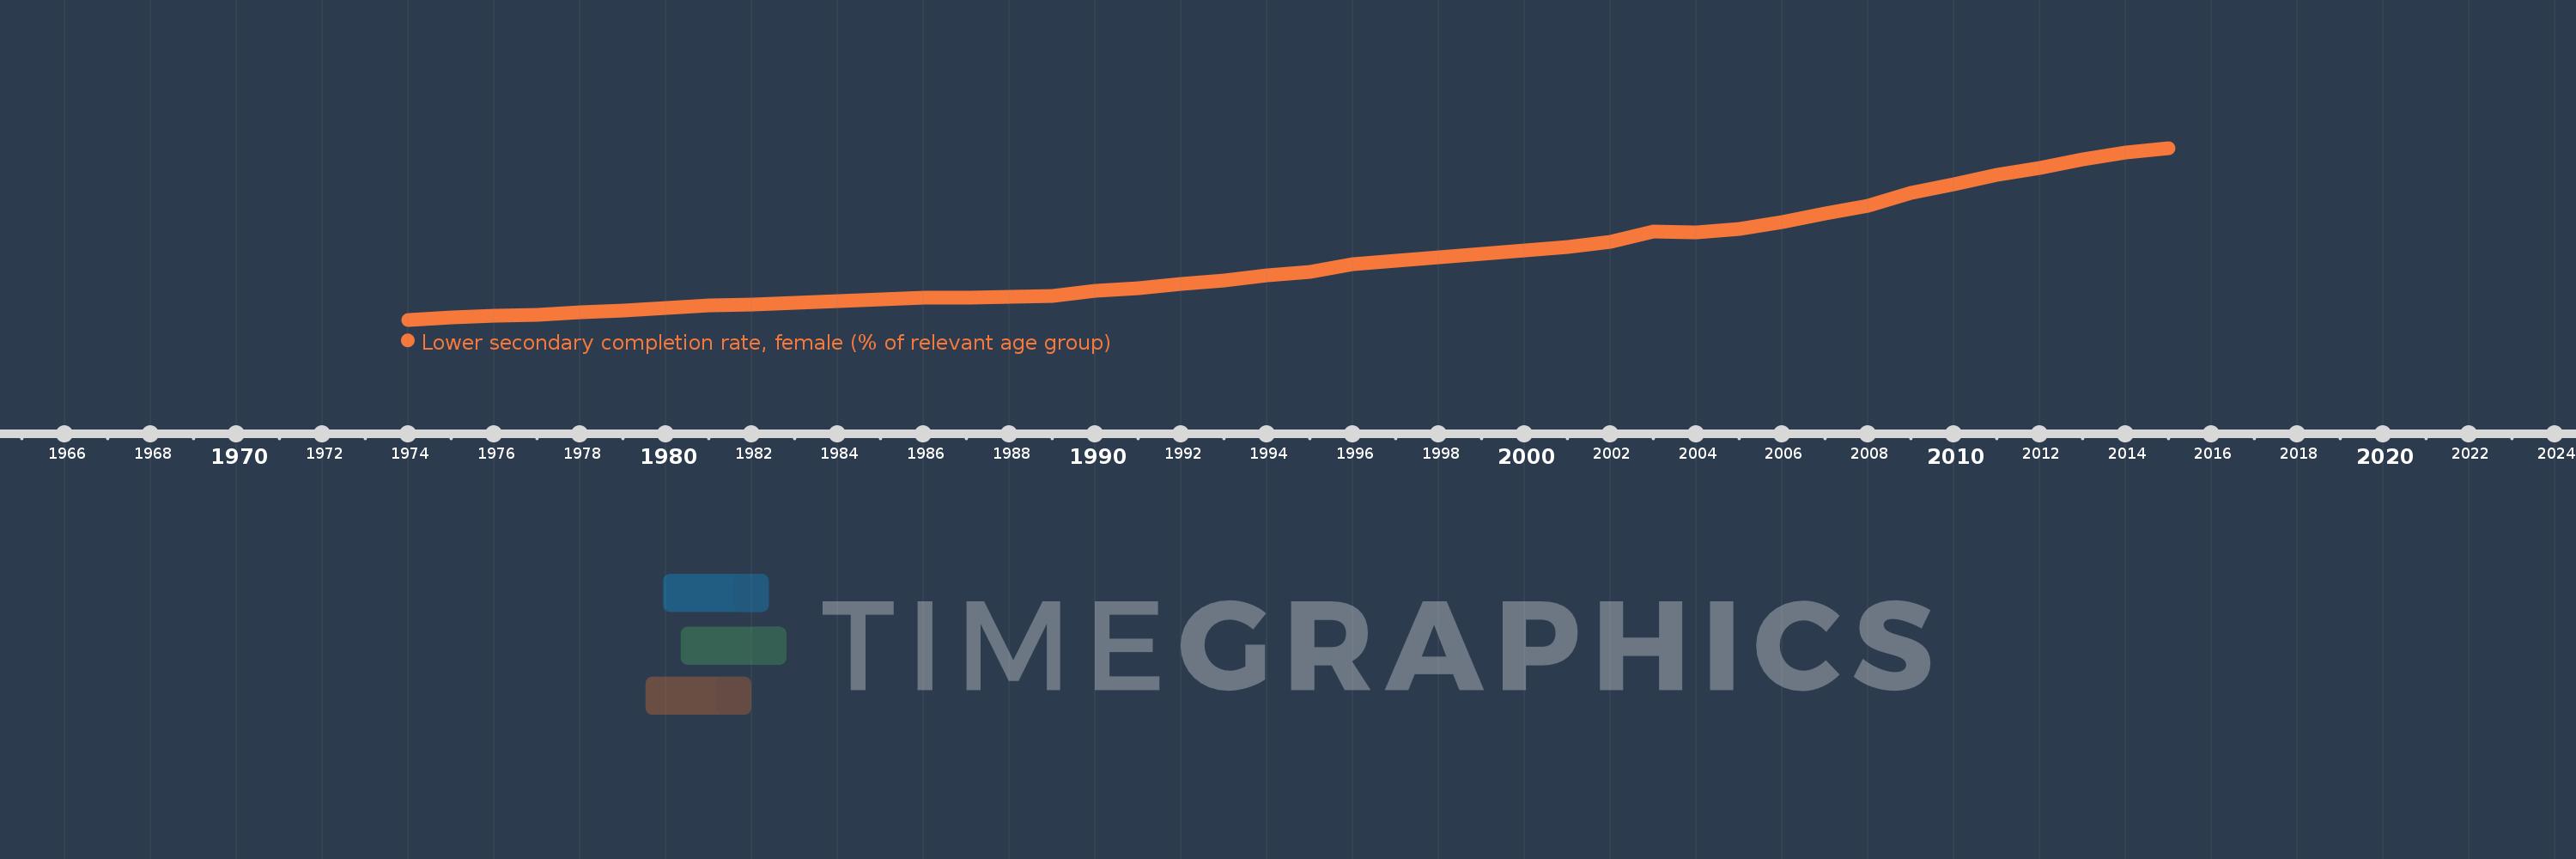
Lower secondary completion rate, female (% of relevant age group)
2015,2014,2013,2012,2011,2010,2009,2008,2007,2006,2005,2004,2003,2002,2001,2000,1999,1998,1997,1996,1995,1994,1993,1992,1991,1990,1989,1988,1987,1986,1985,1984,1983,1982,1981,1980,1979,1978,1977,1976,1975,1974
This statistics in other country:
AfghanistanAlbaniaAlgeriaAngolaAntigua and BarbudaArab WorldArgentinaArmeniaArubaAustriaAzerbaijanBahamas, TheBahrainBangladeshBarbadosBelarusBelgiumBelizeBeninBermudaBhutanBoliviaBosnia and HerzegovinaBotswanaBrunei DarussalamBulgariaBurkina FasoBurundiCabo VerdeCambodiaCameroonCaribbean small statesCentral African RepublicCentral Europe and the BalticsChadChileChinaColombiaComorosCongo, Dem. Rep.Congo, Rep.Costa RicaCote d'IvoireCroatiaCubaCyprusCzech RepublicDenmarkDjiboutiDominicaDominican RepublicEarly-demographic dividendEast Asia & PacificEast Asia & Pacific (excluding high income)East Asia & Pacific (IDA & IBRD countries)EcuadorEgypt, Arab Rep.El SalvadorEquatorial GuineaEritreaEstoniaEthiopiaEuro areaEurope & Central AsiaEurope & Central Asia (excluding high income)Europe & Central Asia (IDA & IBRD countries)European UnionFijiFinlandFragile and conflict affected situationsFranceGabonGambia, TheGeorgiaGermanyGhanaGreeceGrenadaGuatemalaGuineaGuinea-BissauGuyanaHaitiHeavily indebted poor countries (HIPC)High incomeHondurasHong Kong SAR, ChinaHungaryIBRD onlyIcelandIDA & IBRD totalIDA blendIDA onlyIDA totalIndiaIndonesiaIran, Islamic Rep.IraqIrelandIsraelItalyJamaicaJapanJordanKazakhstanKenyaKiribatiKorea, Dem. People’s Rep.Korea, Rep.KuwaitKyrgyz RepublicLao PDRLate-demographic dividendLatin America & Caribbean Latin America & Caribbean (excluding high income)Latin America & the Caribbean (IDA & IBRD countries)LatviaLeast developed countries: UN classificationLebanonLesothoLiberiaLiechtensteinLithuaniaLow & middle incomeLow incomeLower middle incomeLuxembourgMacao SAR, ChinaMacedonia, FYRMadagascarMalawiMaldivesMaliMaltaMarshall IslandsMauritaniaMauritiusMexicoMiddle East & North AfricaMiddle East & North Africa (excluding high income)Middle East & North Africa (IDA & IBRD countries)Middle incomeMoldovaMongoliaMontenegroMoroccoMozambiqueMyanmarNamibiaNauruNepalNetherlandsNicaraguaNigerNorwayOECD membersOmanOther small statesPacific island small statesPakistanPalauPanamaPapua New GuineaParaguayPeruPhilippinesPolandPortugalPost-demographic dividendPre-demographic dividendQatarRomaniaRussian FederationRwandaSamoaSan MarinoSao Tome and PrincipeSaudi ArabiaSenegalSerbiaSeychellesSierra LeoneSlovak RepublicSloveniaSmall statesSolomon IslandsSouth AfricaSouth AsiaSouth Asia (IDA & IBRD)South SudanSpainSri LankaSt. Kitts and NevisSt. LuciaSt. Vincent and the GrenadinesSub-Saharan Africa Sub-Saharan Africa (excluding high income)Sub-Saharan Africa (IDA & IBRD countries)SudanSurinameSwazilandSwedenSwitzerlandSyrian Arab RepublicTajikistanTanzaniaThailandTimor-LesteTogoTongaTrinidad and TobagoTunisiaTurkeyTuvaluUgandaUkraineUnited Arab EmiratesUpper middle incomeUruguayUzbekistanVanuatuVenezuela, RBVietnamWest Bank and GazaWorldYemen, Rep.ZambiaZimbabwe Timeline:
This timeline shows a graph from 1974 to 2015 of Sub-Saharan Africa (IDA & IBRD countries). No data until 1973. Number of actual observations by date: 42.
Source name:
World Development Indicators
Source organization:
United Nations Educational, Scientific, and Cultural Organization (UNESCO) Institute for Statistics.
Categories, topics:
Education
Last updated:
apr 23, 2017
Indicators value changes by year
Maximum:
39.124
jan 1, 2015
At the date of observation
Value
Absolute change
Change from previous value
jan 1, 1974
14.65
+14.65
0.0%
jan 1, 1975
14.937
+0.287
1.96%
jan 1, 1976
15.189
+0.252
1.69%
jan 1, 1977
15.405
+0.215
1.42%
jan 1, 1978
15.767
+0.363
2.35%
jan 1, 1979
15.987
+0.22
1.4%
jan 1, 1980
16.312
+0.325
2.03%
jan 1, 1981
16.674
+0.362
2.22%
jan 1, 1982
16.836
+0.162
0.97%
jan 1, 1983
17.117
+0.28
1.66%
jan 1, 1984
17.269
+0.153
0.89%
jan 1, 1985
17.503
+0.234
1.36%
jan 1, 1986
17.749
+0.246
1.41%
jan 1, 1987
17.83
+0.08
0.45%
jan 1, 1988
17.901
+0.072
0.4%
jan 1, 1989
18.087
+0.186
1.04%
jan 1, 1990
18.726
+0.639
3.53%
jan 1, 1991
19.082
+0.356
1.9%
jan 1, 1992
19.791
+0.709
3.71%
jan 1, 1993
20.251
+0.46
2.32%
jan 1, 1994
21.013
+0.762
3.76%
jan 1, 1995
21.445
+0.432
2.06%
jan 1, 1996
22.531
+1.086
5.06%
jan 1, 1997
23.087
+0.556
2.47%
jan 1, 1998
23.597
+0.51
2.21%
jan 1, 1999
24.076
+0.479
2.03%
jan 1, 2000
24.511
+0.435
1.81%
jan 1, 2001
24.957
+0.446
1.82%
jan 1, 2002
25.752
+0.795
3.18%
jan 1, 2003
27.195
+1.443
5.6%
jan 1, 2004
27.063
-0.132
-0.48%
jan 1, 2005
27.539
+0.476
1.76%
jan 1, 2006
28.574
+1.034
3.76%
jan 1, 2007
29.811
+1.237
4.33%
jan 1, 2008
30.931
+1.12
3.76%
jan 1, 2009
32.761
+1.83
5.92%
jan 1, 2010
33.995
+1.234
3.77%
jan 1, 2011
35.236
+1.241
3.65%
jan 1, 2012
36.296
+1.06
3.01%
jan 1, 2013
37.45
+1.154
3.18%
jan 1, 2014
38.527
+1.077
2.88%
jan 1, 2015
39.124
+0.598
1.55%
Ranking of countries by current statistics by years


Comments: