29
/
en
AIzaSyAYiBZKx7MnpbEhh9jyipgxe19OcubqV5w
April 1, 2024
238454
Seychelles
SYC
true
2
1
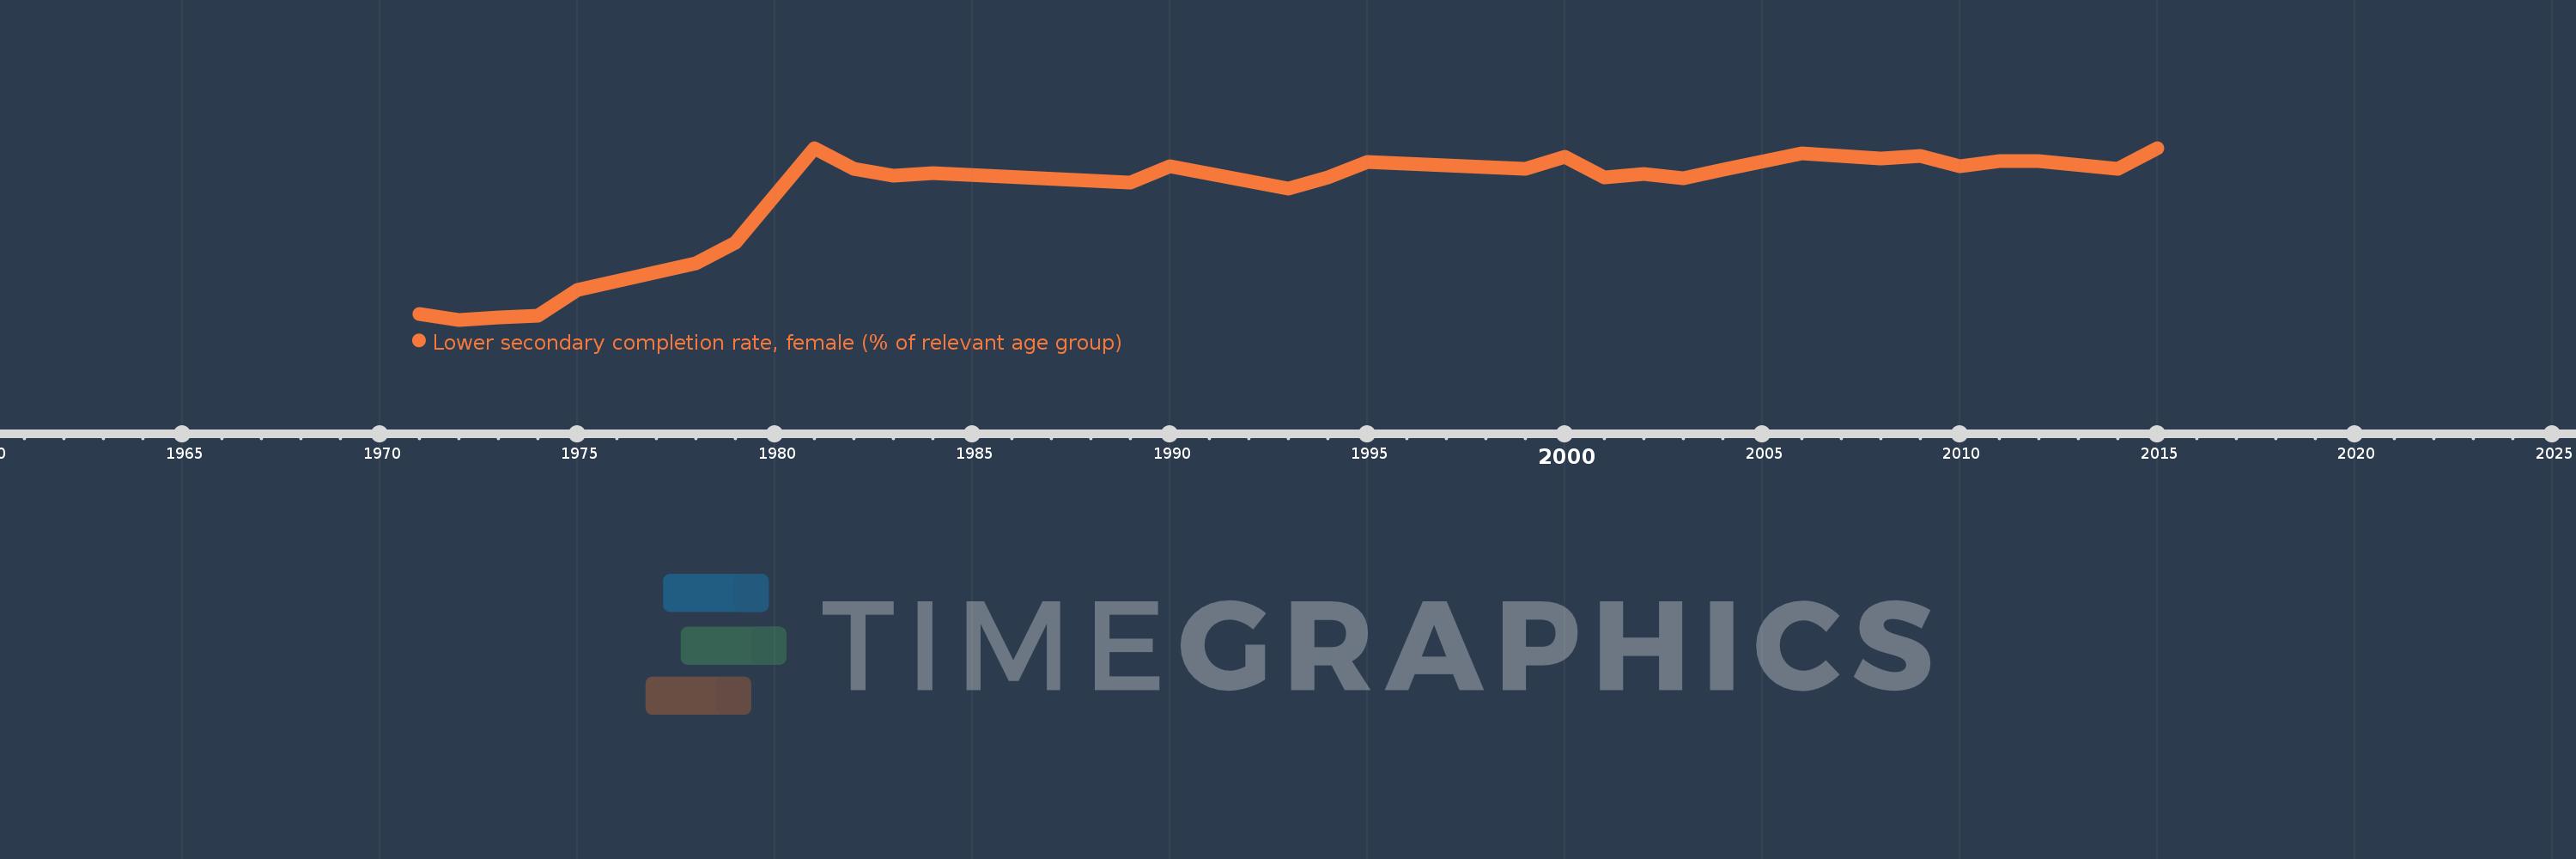
Lower secondary completion rate, female (% of relevant age group)
2015,2014,2012,2011,2010,2009,2008,2006,2004,2003,2002,2001,2000,1999,1995,1994,1993,1990,1989,1984,1983,1982,1981,1979,1978,1975,1974,1973,1972,1971
This statistics in other country:
AfghanistanAlbaniaAlgeriaAngolaAntigua and BarbudaArab WorldArgentinaArmeniaArubaAustriaAzerbaijanBahamas, TheBahrainBangladeshBarbadosBelarusBelgiumBelizeBeninBermudaBhutanBoliviaBosnia and HerzegovinaBotswanaBrunei DarussalamBulgariaBurkina FasoBurundiCabo VerdeCambodiaCameroonCaribbean small statesCentral African RepublicCentral Europe and the BalticsChadChileChinaColombiaComorosCongo, Dem. Rep.Congo, Rep.Costa RicaCote d'IvoireCroatiaCubaCyprusCzech RepublicDenmarkDjiboutiDominicaDominican RepublicEarly-demographic dividendEast Asia & PacificEast Asia & Pacific (excluding high income)East Asia & Pacific (IDA & IBRD countries)EcuadorEgypt, Arab Rep.El SalvadorEquatorial GuineaEritreaEstoniaEthiopiaEuro areaEurope & Central AsiaEurope & Central Asia (excluding high income)Europe & Central Asia (IDA & IBRD countries)European UnionFijiFinlandFragile and conflict affected situationsFranceGabonGambia, TheGeorgiaGermanyGhanaGreeceGrenadaGuatemalaGuineaGuinea-BissauGuyanaHaitiHeavily indebted poor countries (HIPC)High incomeHondurasHong Kong SAR, ChinaHungaryIBRD onlyIcelandIDA & IBRD totalIDA blendIDA onlyIDA totalIndiaIndonesiaIran, Islamic Rep.IraqIrelandIsraelItalyJamaicaJapanJordanKazakhstanKenyaKiribatiKorea, Dem. People’s Rep.Korea, Rep.KuwaitKyrgyz RepublicLao PDRLate-demographic dividendLatin America & Caribbean Latin America & Caribbean (excluding high income)Latin America & the Caribbean (IDA & IBRD countries)LatviaLeast developed countries: UN classificationLebanonLesothoLiberiaLiechtensteinLithuaniaLow & middle incomeLow incomeLower middle incomeLuxembourgMacao SAR, ChinaMacedonia, FYRMadagascarMalawiMaldivesMaliMaltaMarshall IslandsMauritaniaMauritiusMexicoMiddle East & North AfricaMiddle East & North Africa (excluding high income)Middle East & North Africa (IDA & IBRD countries)Middle incomeMoldovaMongoliaMontenegroMoroccoMozambiqueMyanmarNamibiaNauruNepalNetherlandsNicaraguaNigerNorwayOECD membersOmanOther small statesPacific island small statesPakistanPalauPanamaPapua New GuineaParaguayPeruPhilippinesPolandPortugalPost-demographic dividendPre-demographic dividendQatarRomaniaRussian FederationRwandaSamoaSan MarinoSao Tome and PrincipeSaudi ArabiaSenegalSerbiaSeychellesSierra LeoneSlovak RepublicSloveniaSmall statesSolomon IslandsSouth AfricaSouth AsiaSouth Asia (IDA & IBRD)South SudanSpainSri LankaSt. Kitts and NevisSt. LuciaSt. Vincent and the GrenadinesSub-Saharan Africa Sub-Saharan Africa (excluding high income)Sub-Saharan Africa (IDA & IBRD countries)SudanSurinameSwazilandSwedenSwitzerlandSyrian Arab RepublicTajikistanTanzaniaThailandTimor-LesteTogoTongaTrinidad and TobagoTunisiaTurkeyTuvaluUgandaUkraineUnited Arab EmiratesUpper middle incomeUruguayUzbekistanVanuatuVenezuela, RBVietnamWest Bank and GazaWorldYemen, Rep.ZambiaZimbabwe Timeline:
This timeline shows a graph from 1971 to 2015 of Seychelles. No data until 1970. Number of actual observations by date: 30.
Source name:
World Development Indicators
Source organization:
United Nations Educational, Scientific, and Cultural Organization (UNESCO) Institute for Statistics.
Categories, topics:
Education
Last updated:
apr 23, 2017
Indicators value changes by year
Maximum:
116.045
jan 1, 1981
At the date of observation
Value
Absolute change
Change from previous value
jan 1, 1971
11.931
+11.931
0.0%
jan 1, 1972
8.333
-3.598
-30.15%
jan 1, 1973
9.985
+1.652
19.82%
jan 1, 1974
10.85
+0.866
8.67%
jan 1, 1975
27.119
+16.268
149.93%
jan 1, 1978
43.678
+16.56
61.06%
jan 1, 1979
56.873
+13.194
30.21%
jan 1, 1981
116.045
+59.172
104.04%
jan 1, 1982
103.004
-13.041
-11.24%
jan 1, 1983
98.483
-4.521
-4.39%
jan 1, 1984
100.128
+1.645
1.67%
jan 1, 1989
94.51
-5.618
-5.61%
jan 1, 1990
104.645
+10.135
10.72%
jan 1, 1993
90.363
-14.282
-13.65%
jan 1, 1994
97.604
+7.241
8.01%
jan 1, 1995
107.252
+9.648
9.88%
jan 1, 1999
102.767
-4.485
-4.18%
jan 1, 2000
110.705
+7.938
7.72%
jan 1, 2001
97.355
-13.35
-12.06%
jan 1, 2002
99.484
+2.129
2.19%
jan 1, 2003
97.219
-2.265
-2.28%
jan 1, 2004
102.432
+5.214
5.36%
jan 1, 2006
112.76
+10.328
10.08%
jan 1, 2008
109.524
-3.236
-2.87%
jan 1, 2009
110.788
+1.265
1.15%
jan 1, 2010
104.694
-6.094
-5.5%
jan 1, 2011
107.906
+3.212
3.07%
jan 1, 2012
107.576
-0.331
-0.31%
jan 1, 2014
102.839
-4.737
-4.4%
jan 1, 2015
115.873
+13.034
12.67%
Ranking of countries by current statistics by years


Comments: