29
/
en
AIzaSyAYiBZKx7MnpbEhh9jyipgxe19OcubqV5w
April 1, 2024
160307
Israel
ISR
true
2
1
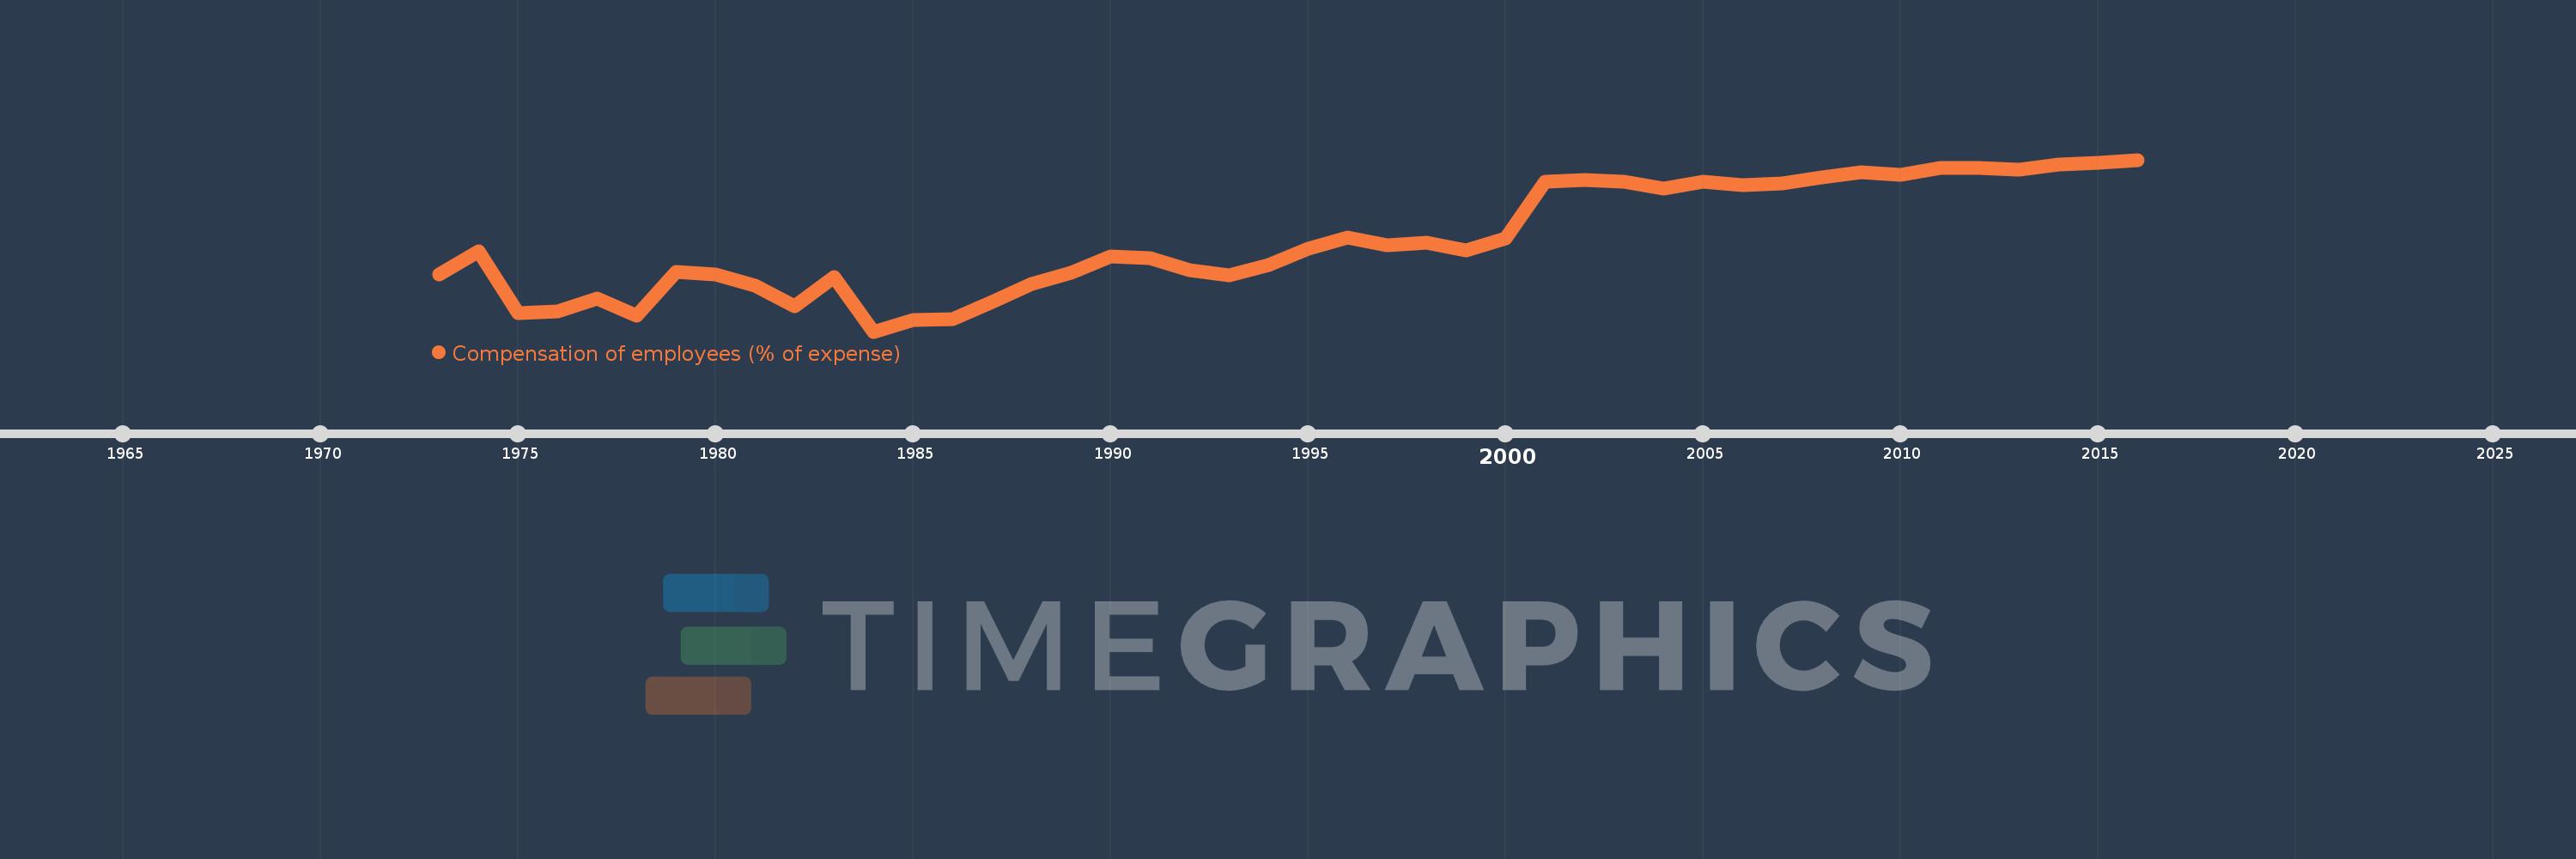
Compensation of employees (% of expense)
2016,2015,2014,2013,2012,2011,2010,2009,2008,2007,2006,2005,2004,2003,2002,2001,2000,1999,1998,1997,1996,1995,1994,1993,1992,1991,1990,1989,1988,1987,1986,1985,1984,1983,1982,1981,1980,1979,1978,1977,1976,1975,1974,1973
This statistics in other country:
AfghanistanAlbaniaAlgeriaAngolaAntigua and BarbudaArab WorldArmeniaAustraliaAustriaAzerbaijanBahamas, TheBahrainBangladeshBarbadosBelarusBelgiumBelizeBeninBhutanBoliviaBosnia and HerzegovinaBotswanaBrazilBulgariaBurkina FasoBurundiCabo VerdeCambodiaCanadaCaribbean small statesCentral African RepublicCentral Europe and the BalticsChileColombiaCongo, Dem. Rep.Congo, Rep.Costa RicaCote d'IvoireCroatiaCyprusCzech RepublicDenmarkDominicaDominican RepublicEarly-demographic dividendEast Asia & PacificEast Asia & Pacific (excluding high income)East Asia & Pacific (IDA & IBRD countries)Egypt, Arab Rep.El SalvadorEquatorial GuineaEstoniaEthiopiaEuro areaEurope & Central AsiaEurope & Central Asia (excluding high income)Europe & Central Asia (IDA & IBRD countries)European UnionFijiFinlandFranceGambia, TheGeorgiaGermanyGhanaGreeceGrenadaGuatemalaHeavily indebted poor countries (HIPC)High incomeHondurasHong Kong SAR, ChinaHungaryIBRD onlyIcelandIDA & IBRD totalIDA blendIDA onlyIDA totalIndiaIndonesiaIran, Islamic Rep.IraqIrelandIsraelItalyJamaicaJapanJordanKazakhstanKenyaKiribatiKorea, Rep.KuwaitKyrgyz RepublicLao PDRLate-demographic dividendLatin America & Caribbean Latin America & Caribbean (excluding high income)Latin America & the Caribbean (IDA & IBRD countries)LatviaLeast developed countries: UN classificationLebanonLesothoLiberiaLithuaniaLow & middle incomeLow incomeLower middle incomeLuxembourgMacao SAR, ChinaMacedonia, FYRMadagascarMalawiMalaysiaMaldivesMaliMaltaMauritiusMexicoMicronesia, Fed. Sts.Middle East & North AfricaMiddle East & North Africa (excluding high income)Middle East & North Africa (IDA & IBRD countries)Middle incomeMoldovaMongoliaMoroccoMozambiqueNamibiaNepalNetherlandsNew ZealandNicaraguaNigeriaNorth AmericaNorwayOECD membersOmanOther small statesPakistanPanamaPapua New GuineaParaguayPeruPhilippinesPolandPortugalPost-demographic dividendPre-demographic dividendQatarRomaniaRussian FederationRwandaSamoaSan MarinoSao Tome and PrincipeSenegalSerbiaSeychellesSierra LeoneSingaporeSlovak RepublicSloveniaSmall statesSolomon IslandsSouth AfricaSouth AsiaSouth Asia (IDA & IBRD)SpainSri LankaSt. Kitts and NevisSt. LuciaSub-Saharan Africa Sub-Saharan Africa (excluding high income)Sub-Saharan Africa (IDA & IBRD countries)SurinameSwazilandSwedenSwitzerlandSyrian Arab RepublicTajikistanTanzaniaThailandTimor-LesteTogoTrinidad and TobagoTunisiaTurkeyUgandaUkraineUnited Arab EmiratesUnited KingdomUnited StatesUpper middle incomeUruguayVanuatuVenezuela, RBWest Bank and GazaWorldYemen, Rep.ZambiaZimbabwe Timeline:
This timeline shows a graph from 1973 to 2016 of Israel. No data until 1972. Number of actual observations by date: 44.
Source name:
World Development Indicators
Source organization:
International Monetary Fund, Government Finance Statistics Yearbook and data files.
Categories, topics:
Public Sector
Last updated:
apr 23, 2017
Indicators value changes by year
Minimum:
10.047
jan 1, 1984
Maximum:
22.722
jan 1, 2016
At the date of observation
Value
Absolute change
Change from previous value
jan 1, 1973
14.286
+14.286
0.0%
jan 1, 1974
16.0
+1.714
12.0%
jan 1, 1975
11.429
-4.571
-28.57%
jan 1, 1976
11.538
+0.11
0.96%
jan 1, 1977
12.5
+0.962
8.33%
jan 1, 1978
11.215
-1.285
-10.28%
jan 1, 1979
14.465
+3.25
28.98%
jan 1, 1980
14.286
-0.18
-1.24%
jan 1, 1981
13.433
-0.853
-5.97%
jan 1, 1982
11.917
-1.516
-11.29%
jan 1, 1983
14.08
+2.163
18.15%
jan 1, 1984
10.047
-4.033
-28.65%
jan 1, 1985
10.904
+0.857
8.53%
jan 1, 1986
10.996
+0.092
0.84%
jan 1, 1987
12.236
+1.239
11.27%
jan 1, 1988
13.587
+1.352
11.05%
jan 1, 1989
14.418
+0.831
6.11%
jan 1, 1990
15.591
+1.173
8.14%
jan 1, 1991
15.478
-0.113
-0.73%
jan 1, 1992
14.607
-0.871
-5.63%
jan 1, 1993
14.211
-0.396
-2.71%
jan 1, 1994
14.976
+0.765
5.38%
jan 1, 1995
16.162
+1.186
7.92%
jan 1, 1996
17.018
+0.856
5.29%
jan 1, 1997
16.397
-0.621
-3.65%
jan 1, 1998
16.576
+0.179
1.09%
jan 1, 1999
16.054
-0.522
-3.15%
jan 1, 2000
16.943
+0.89
5.54%
jan 1, 2001
21.108
+4.165
24.58%
jan 1, 2002
21.248
+0.139
0.66%
jan 1, 2003
21.088
-0.16
-0.75%
jan 1, 2004
20.621
-0.467
-2.21%
jan 1, 2005
21.101
+0.48
2.33%
jan 1, 2006
20.83
-0.271
-1.28%
jan 1, 2007
20.963
+0.132
0.64%
jan 1, 2008
21.398
+0.435
2.08%
jan 1, 2009
21.817
+0.419
1.96%
jan 1, 2010
21.624
-0.193
-0.89%
jan 1, 2011
22.093
+0.469
2.17%
jan 1, 2012
22.14
+0.047
0.21%
jan 1, 2013
22.015
-0.125
-0.56%
jan 1, 2014
22.369
+0.354
1.61%
jan 1, 2015
22.507
+0.138
0.62%
jan 1, 2016
22.722
+0.214
0.95%
Ranking of countries by current statistics by years


Comments: