29
/
en
AIzaSyAYiBZKx7MnpbEhh9jyipgxe19OcubqV5w
April 1, 2024
124594
Egypt, Arab Rep.
EGY
true
2
1
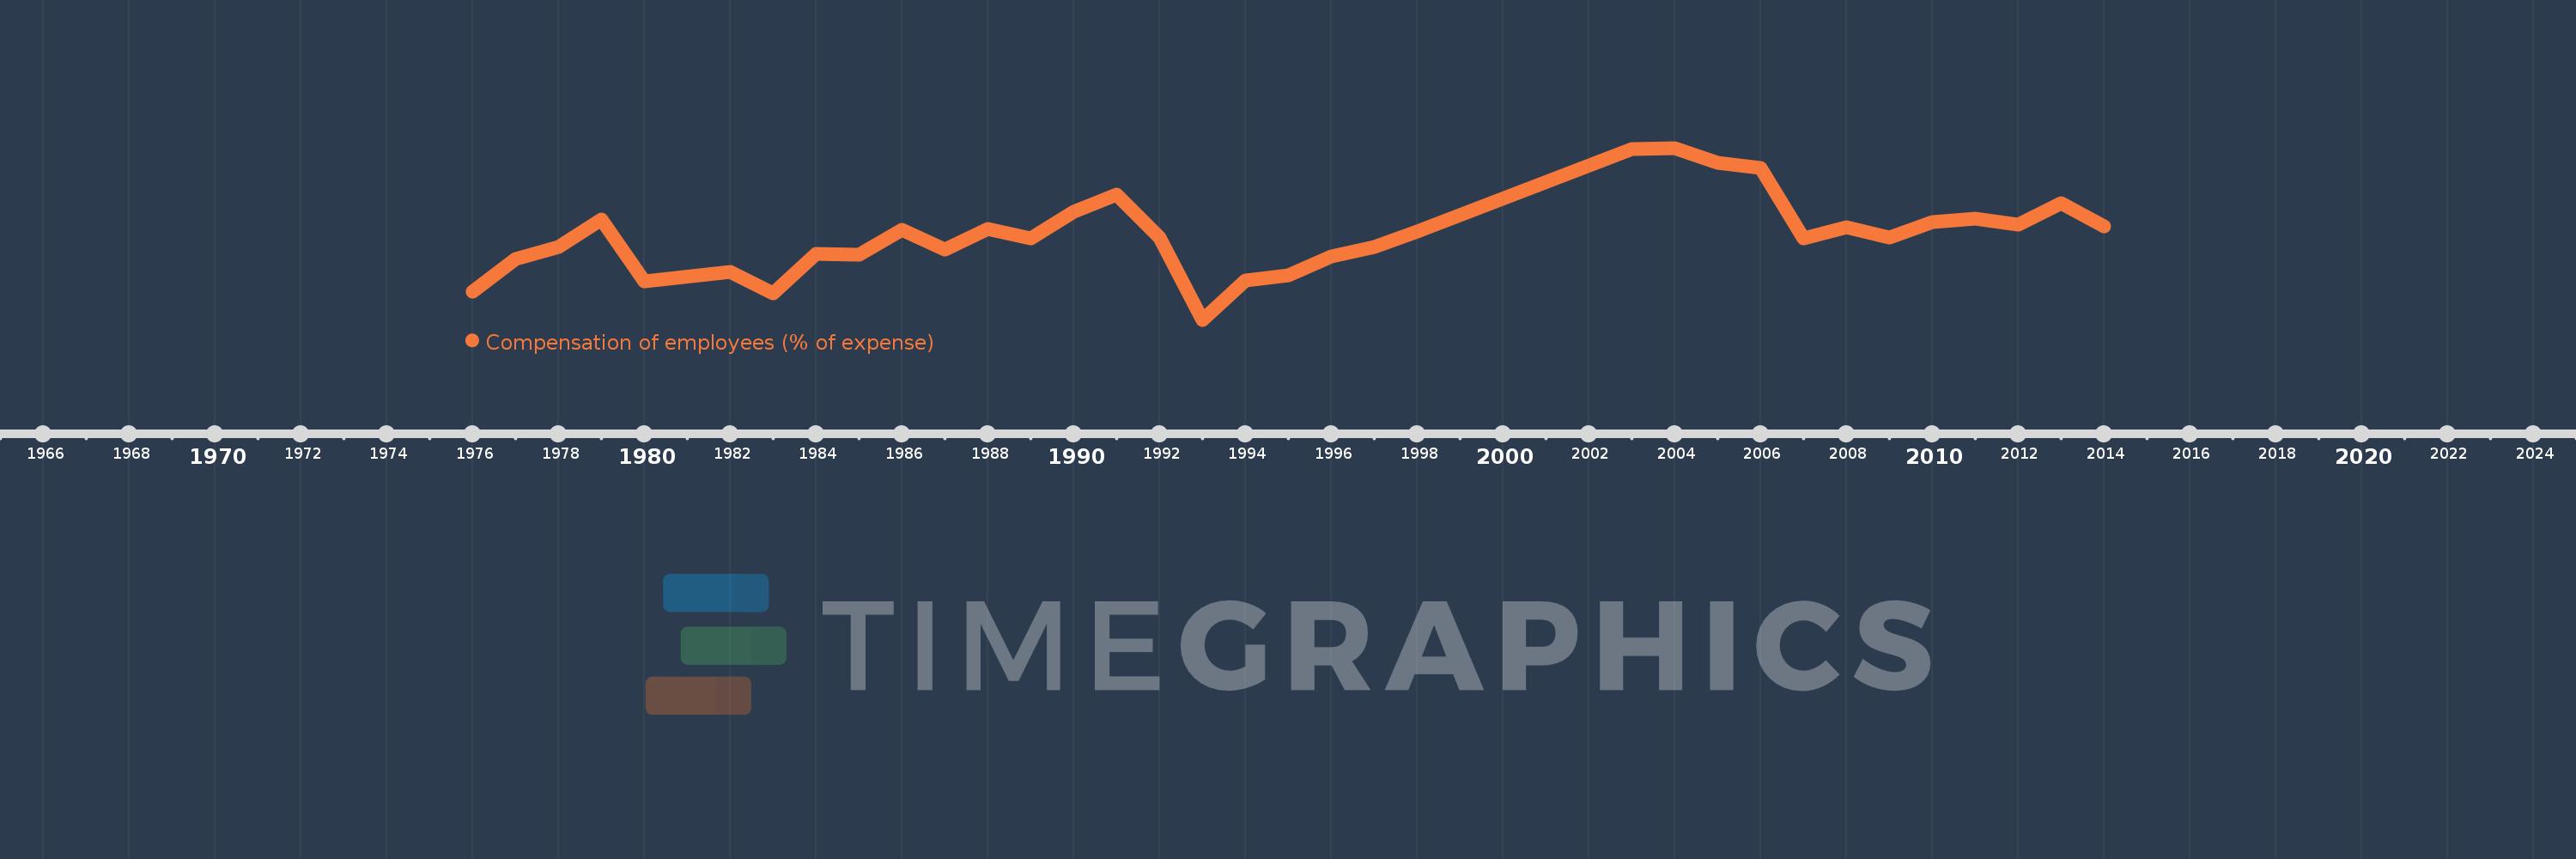
Compensation of employees (% of expense)
2014,2013,2012,2011,2010,2009,2008,2007,2006,2005,2004,2003,1998,1997,1996,1995,1994,1993,1992,1991,1990,1989,1988,1987,1986,1985,1984,1983,1982,1980,1979,1978,1977,1976
This statistics in other country:
AfghanistanAlbaniaAlgeriaAngolaAntigua and BarbudaArab WorldArmeniaAustraliaAustriaAzerbaijanBahamas, TheBahrainBangladeshBarbadosBelarusBelgiumBelizeBeninBhutanBoliviaBosnia and HerzegovinaBotswanaBrazilBulgariaBurkina FasoBurundiCabo VerdeCambodiaCanadaCaribbean small statesCentral African RepublicCentral Europe and the BalticsChileColombiaCongo, Dem. Rep.Congo, Rep.Costa RicaCote d'IvoireCroatiaCyprusCzech RepublicDenmarkDominicaDominican RepublicEarly-demographic dividendEast Asia & PacificEast Asia & Pacific (excluding high income)East Asia & Pacific (IDA & IBRD countries)Egypt, Arab Rep.El SalvadorEquatorial GuineaEstoniaEthiopiaEuro areaEurope & Central AsiaEurope & Central Asia (excluding high income)Europe & Central Asia (IDA & IBRD countries)European UnionFijiFinlandFranceGambia, TheGeorgiaGermanyGhanaGreeceGrenadaGuatemalaHeavily indebted poor countries (HIPC)High incomeHondurasHong Kong SAR, ChinaHungaryIBRD onlyIcelandIDA & IBRD totalIDA blendIDA onlyIDA totalIndiaIndonesiaIran, Islamic Rep.IraqIrelandIsraelItalyJamaicaJapanJordanKazakhstanKenyaKiribatiKorea, Rep.KuwaitKyrgyz RepublicLao PDRLate-demographic dividendLatin America & Caribbean Latin America & Caribbean (excluding high income)Latin America & the Caribbean (IDA & IBRD countries)LatviaLeast developed countries: UN classificationLebanonLesothoLiberiaLithuaniaLow & middle incomeLow incomeLower middle incomeLuxembourgMacao SAR, ChinaMacedonia, FYRMadagascarMalawiMalaysiaMaldivesMaliMaltaMauritiusMexicoMicronesia, Fed. Sts.Middle East & North AfricaMiddle East & North Africa (excluding high income)Middle East & North Africa (IDA & IBRD countries)Middle incomeMoldovaMongoliaMoroccoMozambiqueNamibiaNepalNetherlandsNew ZealandNicaraguaNigeriaNorth AmericaNorwayOECD membersOmanOther small statesPakistanPanamaPapua New GuineaParaguayPeruPhilippinesPolandPortugalPost-demographic dividendPre-demographic dividendQatarRomaniaRussian FederationRwandaSamoaSan MarinoSao Tome and PrincipeSenegalSerbiaSeychellesSierra LeoneSingaporeSlovak RepublicSloveniaSmall statesSolomon IslandsSouth AfricaSouth AsiaSouth Asia (IDA & IBRD)SpainSri LankaSt. Kitts and NevisSt. LuciaSub-Saharan Africa Sub-Saharan Africa (excluding high income)Sub-Saharan Africa (IDA & IBRD countries)SurinameSwazilandSwedenSwitzerlandSyrian Arab RepublicTajikistanTanzaniaThailandTimor-LesteTogoTrinidad and TobagoTunisiaTurkeyUgandaUkraineUnited Arab EmiratesUnited KingdomUnited StatesUpper middle incomeUruguayVanuatuVenezuela, RBWest Bank and GazaWorldYemen, Rep.ZambiaZimbabwe Timeline:
This timeline shows a graph from 1976 to 2014 of Egypt, Arab Rep.. No data until 1975. Number of actual observations by date: 34.
Source name:
World Development Indicators
Source organization:
International Monetary Fund, Government Finance Statistics Yearbook and data files.
Categories, topics:
Public Sector
Last updated:
apr 23, 2017
Indicators value changes by year
Minimum:
17.428
jan 1, 1993
Maximum:
29.927
jan 1, 2004
At the date of observation
Value
Absolute change
Change from previous value
jan 1, 1976
19.451
+19.451
0.0%
jan 1, 1977
21.821
+2.37
12.18%
jan 1, 1978
22.732
+0.912
4.18%
jan 1, 1979
24.713
+1.98
8.71%
jan 1, 1980
20.212
-4.501
-18.21%
jan 1, 1982
20.927
+0.715
3.54%
jan 1, 1983
19.324
-1.603
-7.66%
jan 1, 1984
22.235
+2.912
15.07%
jan 1, 1985
22.155
-0.081
-0.36%
jan 1, 1986
23.986
+1.831
8.26%
jan 1, 1987
22.526
-1.459
-6.08%
jan 1, 1988
24.016
+1.49
6.61%
jan 1, 1989
23.348
-0.669
-2.78%
jan 1, 1990
25.269
+1.922
8.23%
jan 1, 1991
26.557
+1.288
5.1%
jan 1, 1992
23.426
-3.132
-11.79%
jan 1, 1993
17.428
-5.998
-25.6%
jan 1, 1994
20.26
+2.833
16.25%
jan 1, 1995
20.667
+0.407
2.01%
jan 1, 1996
22.031
+1.363
6.6%
jan 1, 1997
22.726
+0.696
3.16%
jan 1, 1998
23.859
+1.133
4.98%
jan 1, 2003
29.849
+5.99
25.11%
jan 1, 2004
29.927
+0.079
0.26%
jan 1, 2005
28.836
-1.091
-3.65%
jan 1, 2006
28.485
-0.351
-1.22%
jan 1, 2007
23.351
-5.134
-18.02%
jan 1, 2008
24.141
+0.791
3.39%
jan 1, 2009
23.4
-0.741
-3.07%
jan 1, 2010
24.554
+1.154
4.93%
jan 1, 2011
24.805
+0.251
1.02%
jan 1, 2012
24.336
-0.469
-1.89%
jan 1, 2013
25.904
+1.568
6.44%
jan 1, 2014
24.214
-1.689
-6.52%
Ranking of countries by current statistics by years


Comments: