29
/
en
AIzaSyAYiBZKx7MnpbEhh9jyipgxe19OcubqV5w
April 1, 2024
90916
Brazil
BRA
true
2
1
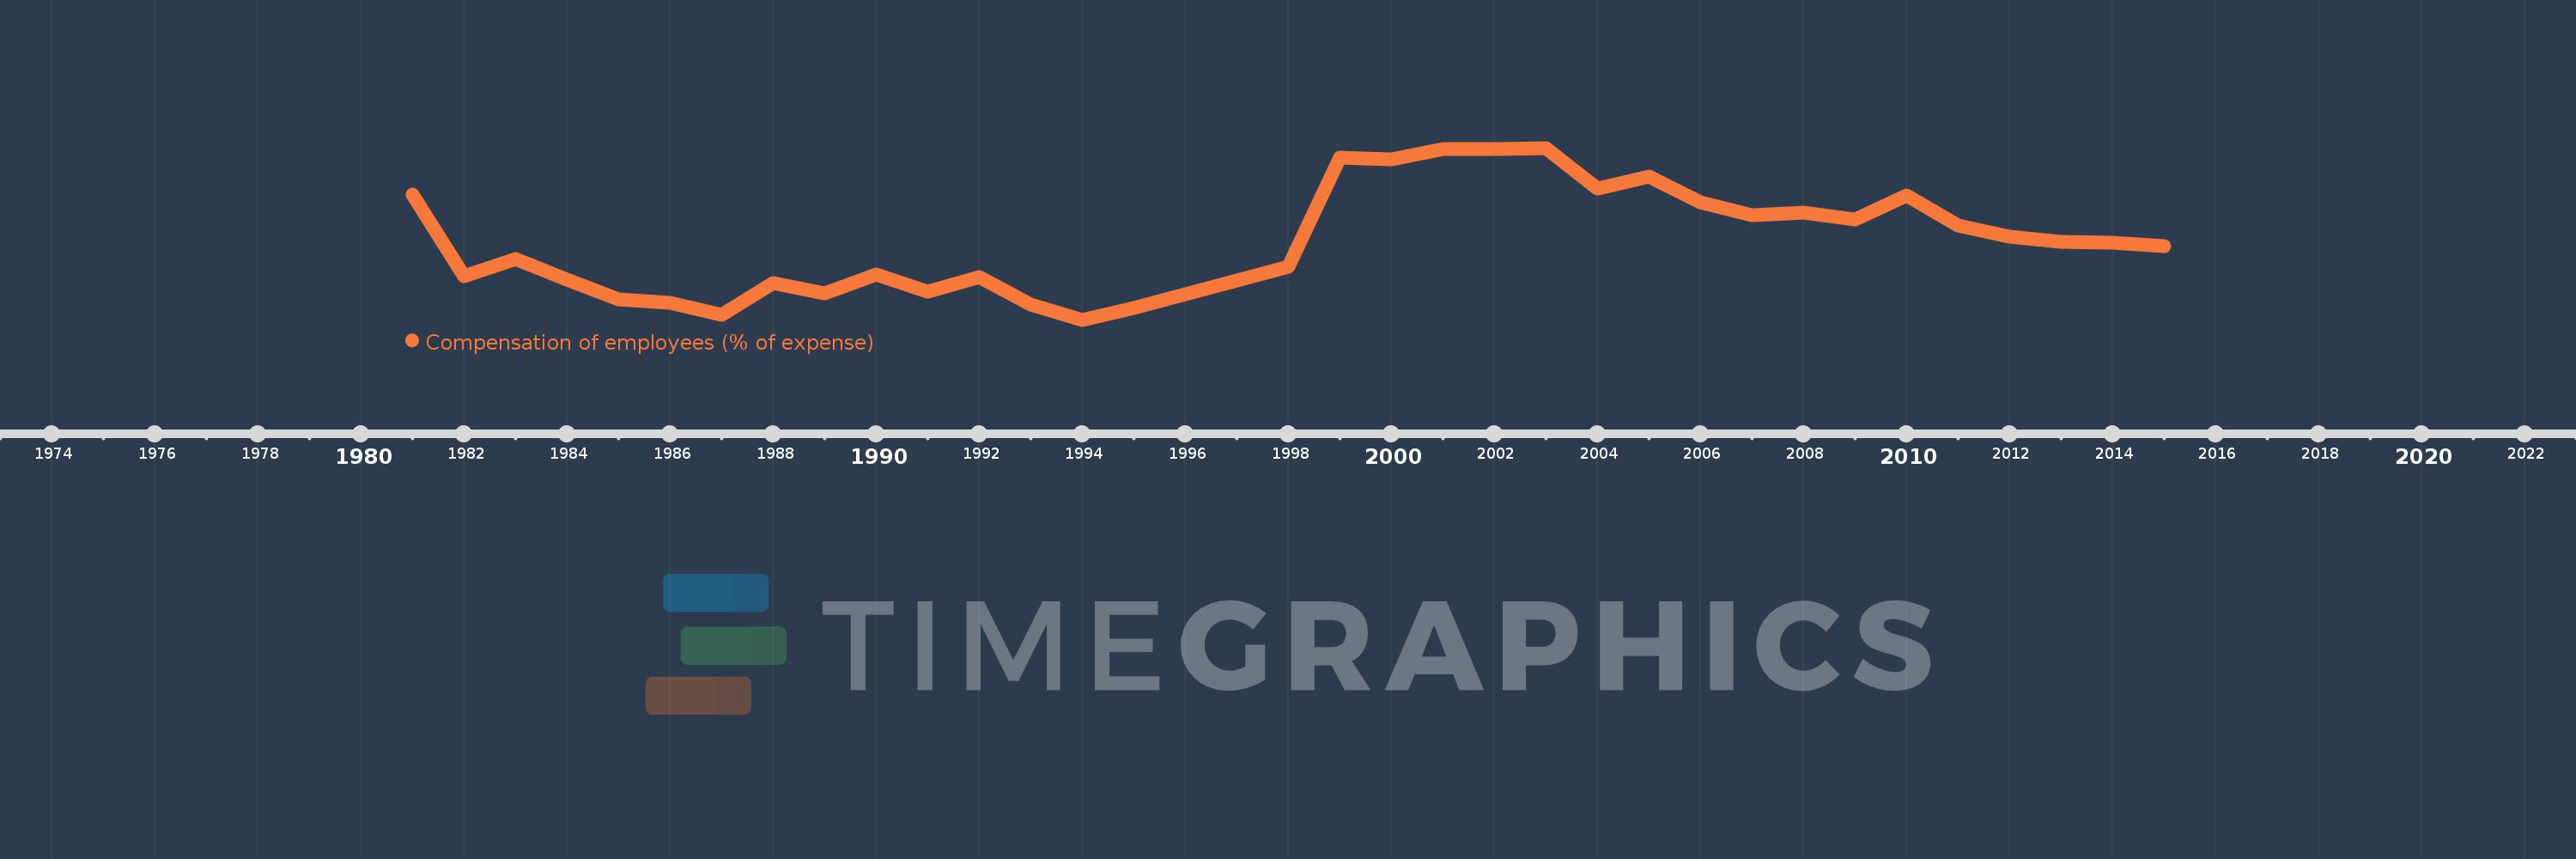
Compensation of employees (% of expense)
2015,2014,2013,2012,2011,2010,2009,2008,2007,2006,2005,2004,2003,2002,2001,2000,1999,1998,1995,1994,1993,1992,1991,1990,1989,1988,1987,1986,1985,1984,1983,1982,1981
This statistics in other country:
AfghanistanAlbaniaAlgeriaAngolaAntigua and BarbudaArab WorldArmeniaAustraliaAustriaAzerbaijanBahamas, TheBahrainBangladeshBarbadosBelarusBelgiumBelizeBeninBhutanBoliviaBosnia and HerzegovinaBotswanaBrazilBulgariaBurkina FasoBurundiCabo VerdeCambodiaCanadaCaribbean small statesCentral African RepublicCentral Europe and the BalticsChileColombiaCongo, Dem. Rep.Congo, Rep.Costa RicaCote d'IvoireCroatiaCyprusCzech RepublicDenmarkDominicaDominican RepublicEarly-demographic dividendEast Asia & PacificEast Asia & Pacific (excluding high income)East Asia & Pacific (IDA & IBRD countries)Egypt, Arab Rep.El SalvadorEquatorial GuineaEstoniaEthiopiaEuro areaEurope & Central AsiaEurope & Central Asia (excluding high income)Europe & Central Asia (IDA & IBRD countries)European UnionFijiFinlandFranceGambia, TheGeorgiaGermanyGhanaGreeceGrenadaGuatemalaHeavily indebted poor countries (HIPC)High incomeHondurasHong Kong SAR, ChinaHungaryIBRD onlyIcelandIDA & IBRD totalIDA blendIDA onlyIDA totalIndiaIndonesiaIran, Islamic Rep.IraqIrelandIsraelItalyJamaicaJapanJordanKazakhstanKenyaKiribatiKorea, Rep.KuwaitKyrgyz RepublicLao PDRLate-demographic dividendLatin America & Caribbean Latin America & Caribbean (excluding high income)Latin America & the Caribbean (IDA & IBRD countries)LatviaLeast developed countries: UN classificationLebanonLesothoLiberiaLithuaniaLow & middle incomeLow incomeLower middle incomeLuxembourgMacao SAR, ChinaMacedonia, FYRMadagascarMalawiMalaysiaMaldivesMaliMaltaMauritiusMexicoMicronesia, Fed. Sts.Middle East & North AfricaMiddle East & North Africa (excluding high income)Middle East & North Africa (IDA & IBRD countries)Middle incomeMoldovaMongoliaMoroccoMozambiqueNamibiaNepalNetherlandsNew ZealandNicaraguaNigeriaNorth AmericaNorwayOECD membersOmanOther small statesPakistanPanamaPapua New GuineaParaguayPeruPhilippinesPolandPortugalPost-demographic dividendPre-demographic dividendQatarRomaniaRussian FederationRwandaSamoaSan MarinoSao Tome and PrincipeSenegalSerbiaSeychellesSierra LeoneSingaporeSlovak RepublicSloveniaSmall statesSolomon IslandsSouth AfricaSouth AsiaSouth Asia (IDA & IBRD)SpainSri LankaSt. Kitts and NevisSt. LuciaSub-Saharan Africa Sub-Saharan Africa (excluding high income)Sub-Saharan Africa (IDA & IBRD countries)SurinameSwazilandSwedenSwitzerlandSyrian Arab RepublicTajikistanTanzaniaThailandTimor-LesteTogoTrinidad and TobagoTunisiaTurkeyUgandaUkraineUnited Arab EmiratesUnited KingdomUnited StatesUpper middle incomeUruguayVanuatuVenezuela, RBWest Bank and GazaWorldYemen, Rep.ZambiaZimbabwe Timeline:
This timeline shows a graph from 1981 to 2015 of Brazil. No data until 1980. Number of actual observations by date: 33.
Source name:
World Development Indicators
Source organization:
International Monetary Fund, Government Finance Statistics Yearbook and data files.
Categories, topics:
Public Sector
Last updated:
apr 23, 2017
Indicators value changes by year
Maximum:
21.103
jan 1, 2003
At the date of observation
Value
Absolute change
Change from previous value
jan 1, 1981
17.391
+17.391
0.0%
jan 1, 1982
10.87
-6.522
-37.5%
jan 1, 1983
12.245
+1.375
12.65%
jan 1, 1984
10.573
-1.672
-13.66%
jan 1, 1985
9.007
-1.566
-14.81%
jan 1, 1986
8.736
-0.271
-3.01%
jan 1, 1987
7.724
-1.012
-11.58%
jan 1, 1988
10.307
+2.583
33.44%
jan 1, 1989
9.444
-0.863
-8.38%
jan 1, 1990
10.997
+1.554
16.45%
jan 1, 1991
9.605
-1.392
-12.66%
jan 1, 1992
10.749
+1.144
11.91%
jan 1, 1993
8.598
-2.151
-20.01%
jan 1, 1994
7.365
-1.234
-14.35%
jan 1, 1995
8.302
+0.938
12.73%
jan 1, 1998
11.601
+3.299
39.74%
jan 1, 1999
20.352
+8.751
75.43%
jan 1, 2000
20.18
-0.172
-0.84%
jan 1, 2001
21.02
+0.839
4.16%
jan 1, 2002
21.033
+0.014
0.06%
jan 1, 2003
21.103
+0.07
0.33%
jan 1, 2004
17.882
-3.222
-15.27%
jan 1, 2005
18.824
+0.942
5.27%
jan 1, 2006
16.749
-2.074
-11.02%
jan 1, 2007
15.73
-1.019
-6.08%
jan 1, 2008
15.957
+0.227
1.44%
jan 1, 2009
15.407
-0.55
-3.44%
jan 1, 2010
17.276
+1.869
12.13%
jan 1, 2011
14.903
-2.373
-13.73%
jan 1, 2012
14.0
-0.903
-6.06%
jan 1, 2013
13.582
-0.419
-2.99%
jan 1, 2014
13.52
-0.062
-0.46%
jan 1, 2015
13.246
-0.273
-2.02%
Ranking of countries by current statistics by years


Comments: