29
/
en
AIzaSyAYiBZKx7MnpbEhh9jyipgxe19OcubqV5w
April 1, 2024
277474
Uruguay
URY
true
2
1
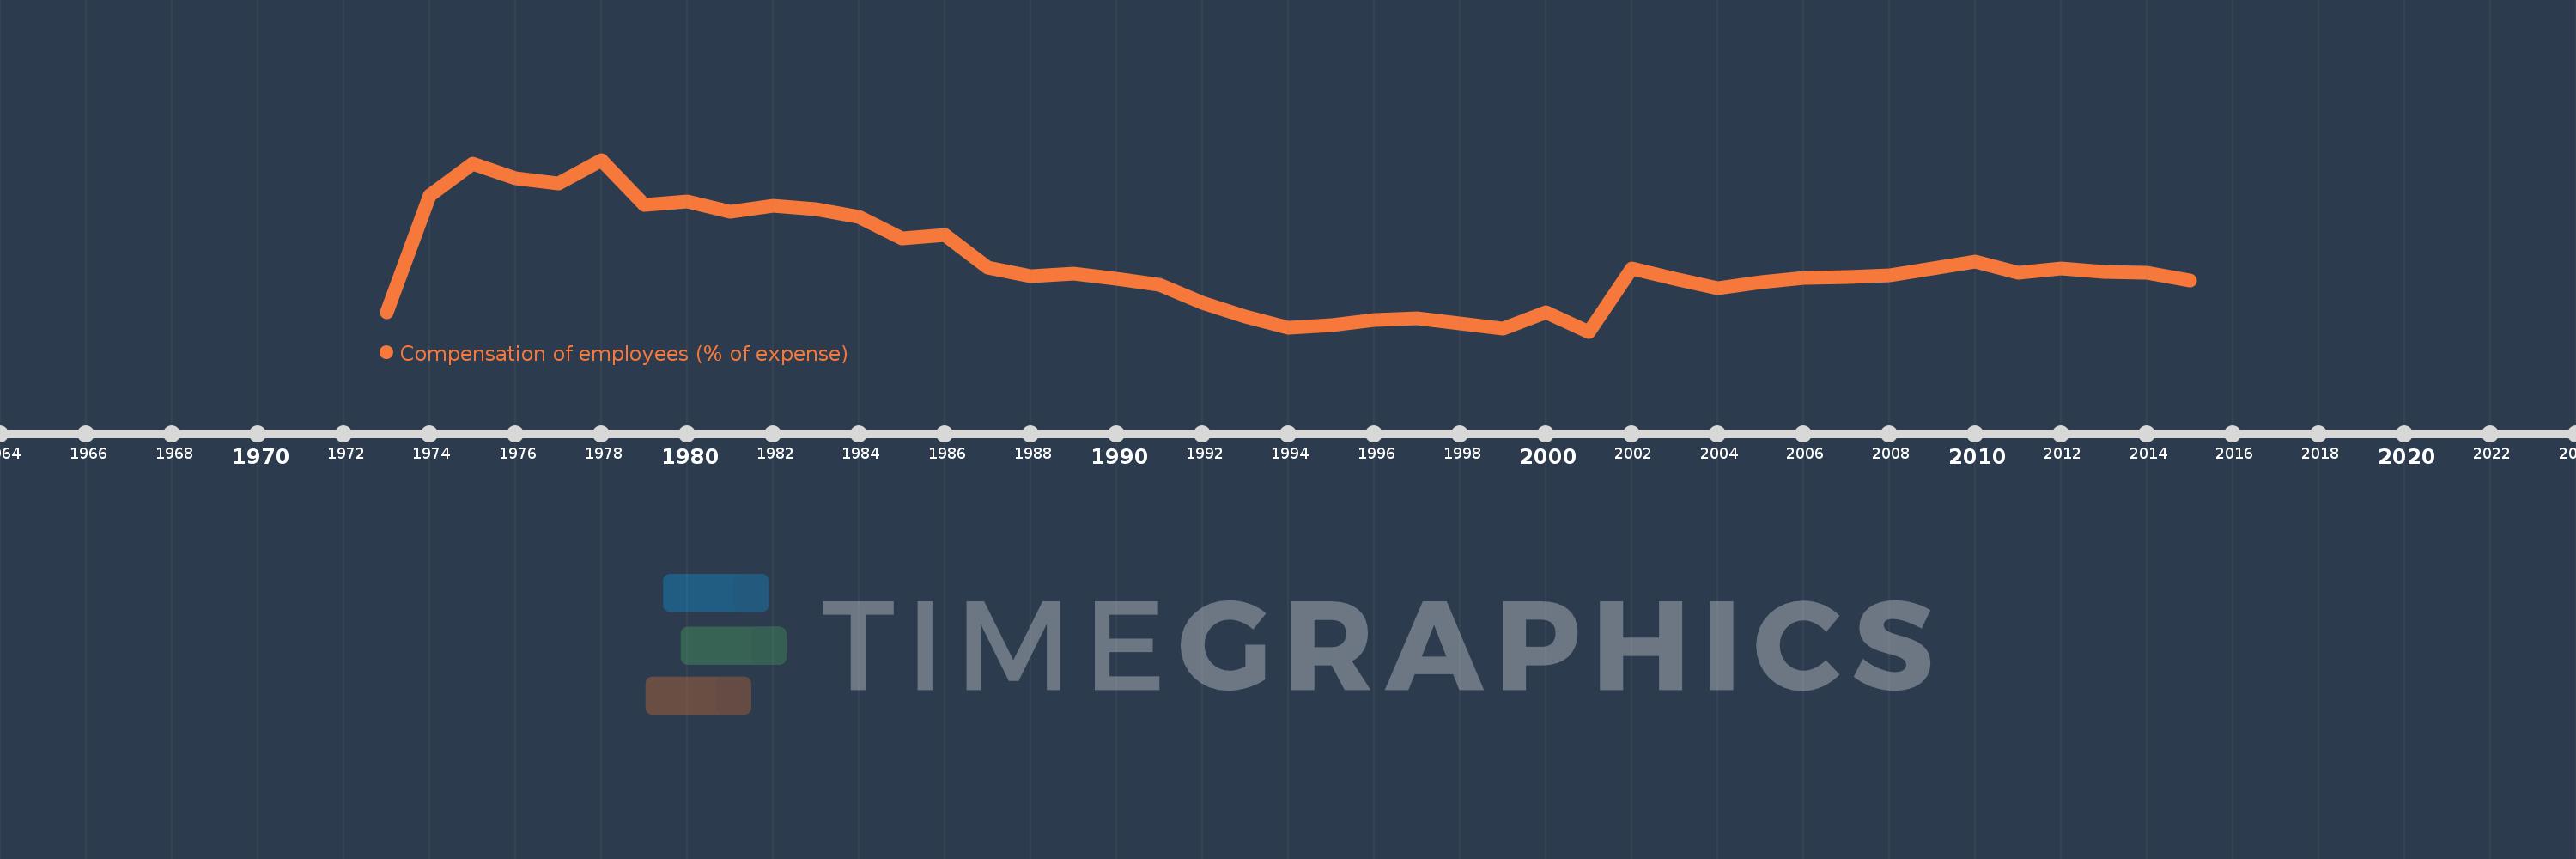
Compensation of employees (% of expense)
2015,2014,2013,2012,2011,2010,2009,2008,2007,2006,2005,2004,2003,2002,2001,2000,1999,1998,1997,1996,1995,1994,1993,1992,1991,1990,1989,1988,1987,1986,1985,1984,1983,1982,1981,1980,1979,1978,1977,1976,1975,1974,1973
This statistics in other country:
AfghanistanAlbaniaAlgeriaAngolaAntigua and BarbudaArab WorldArmeniaAustraliaAustriaAzerbaijanBahamas, TheBahrainBangladeshBarbadosBelarusBelgiumBelizeBeninBhutanBoliviaBosnia and HerzegovinaBotswanaBrazilBulgariaBurkina FasoBurundiCabo VerdeCambodiaCanadaCaribbean small statesCentral African RepublicCentral Europe and the BalticsChileColombiaCongo, Dem. Rep.Congo, Rep.Costa RicaCote d'IvoireCroatiaCyprusCzech RepublicDenmarkDominicaDominican RepublicEarly-demographic dividendEast Asia & PacificEast Asia & Pacific (excluding high income)East Asia & Pacific (IDA & IBRD countries)Egypt, Arab Rep.El SalvadorEquatorial GuineaEstoniaEthiopiaEuro areaEurope & Central AsiaEurope & Central Asia (excluding high income)Europe & Central Asia (IDA & IBRD countries)European UnionFijiFinlandFranceGambia, TheGeorgiaGermanyGhanaGreeceGrenadaGuatemalaHeavily indebted poor countries (HIPC)High incomeHondurasHong Kong SAR, ChinaHungaryIBRD onlyIcelandIDA & IBRD totalIDA blendIDA onlyIDA totalIndiaIndonesiaIran, Islamic Rep.IraqIrelandIsraelItalyJamaicaJapanJordanKazakhstanKenyaKiribatiKorea, Rep.KuwaitKyrgyz RepublicLao PDRLate-demographic dividendLatin America & Caribbean Latin America & Caribbean (excluding high income)Latin America & the Caribbean (IDA & IBRD countries)LatviaLeast developed countries: UN classificationLebanonLesothoLiberiaLithuaniaLow & middle incomeLow incomeLower middle incomeLuxembourgMacao SAR, ChinaMacedonia, FYRMadagascarMalawiMalaysiaMaldivesMaliMaltaMauritiusMexicoMicronesia, Fed. Sts.Middle East & North AfricaMiddle East & North Africa (excluding high income)Middle East & North Africa (IDA & IBRD countries)Middle incomeMoldovaMongoliaMoroccoMozambiqueNamibiaNepalNetherlandsNew ZealandNicaraguaNigeriaNorth AmericaNorwayOECD membersOmanOther small statesPakistanPanamaPapua New GuineaParaguayPeruPhilippinesPolandPortugalPost-demographic dividendPre-demographic dividendQatarRomaniaRussian FederationRwandaSamoaSan MarinoSao Tome and PrincipeSenegalSerbiaSeychellesSierra LeoneSingaporeSlovak RepublicSloveniaSmall statesSolomon IslandsSouth AfricaSouth AsiaSouth Asia (IDA & IBRD)SpainSri LankaSt. Kitts and NevisSt. LuciaSub-Saharan Africa Sub-Saharan Africa (excluding high income)Sub-Saharan Africa (IDA & IBRD countries)SurinameSwazilandSwedenSwitzerlandSyrian Arab RepublicTajikistanTanzaniaThailandTimor-LesteTogoTrinidad and TobagoTunisiaTurkeyUgandaUkraineUnited Arab EmiratesUnited KingdomUnited StatesUpper middle incomeUruguayVanuatuVenezuela, RBWest Bank and GazaWorldYemen, Rep.ZambiaZimbabwe Timeline:
This timeline shows a graph from 1973 to 2015 of Uruguay. No data until 1972. Number of actual observations by date: 43.
Source name:
World Development Indicators
Source organization:
International Monetary Fund, Government Finance Statistics Yearbook and data files.
Categories, topics:
Public Sector
Last updated:
apr 23, 2017
Indicators value changes by year
Minimum:
14.974
jan 1, 2001
Maximum:
38.567
jan 1, 1978
At the date of observation
Value
Absolute change
Change from previous value
jan 1, 1973
17.586
+17.586
0.0%
jan 1, 1974
33.641
+16.055
91.29%
jan 1, 1975
38.071
+4.43
13.17%
jan 1, 1976
35.991
-2.08
-5.46%
jan 1, 1977
35.29
-0.701
-1.95%
jan 1, 1978
38.567
+3.277
9.29%
jan 1, 1979
32.331
-6.236
-16.17%
jan 1, 1980
32.808
+0.477
1.48%
jan 1, 1981
31.41
-1.398
-4.26%
jan 1, 1982
32.263
+0.854
2.72%
jan 1, 1983
31.774
-0.489
-1.52%
jan 1, 1984
30.674
-1.1
-3.46%
jan 1, 1985
27.802
-2.872
-9.36%
jan 1, 1986
28.302
+0.5
1.8%
jan 1, 1987
23.765
-4.537
-16.03%
jan 1, 1988
22.589
-1.176
-4.95%
jan 1, 1989
22.984
+0.395
1.75%
jan 1, 1990
22.269
-0.715
-3.11%
jan 1, 1991
21.402
-0.867
-3.89%
jan 1, 1992
18.951
-2.45
-11.45%
jan 1, 1993
17.075
-1.876
-9.9%
jan 1, 1994
15.492
-1.583
-9.27%
jan 1, 1995
15.894
+0.402
2.6%
jan 1, 1996
16.511
+0.617
3.88%
jan 1, 1997
16.803
+0.292
1.77%
jan 1, 1998
16.122
-0.681
-4.05%
jan 1, 1999
15.424
-0.699
-4.33%
jan 1, 2000
17.614
+2.191
14.2%
jan 1, 2001
14.974
-2.64
-14.99%
jan 1, 2002
23.627
+8.654
57.79%
jan 1, 2003
22.226
-1.401
-5.93%
jan 1, 2004
20.899
-1.327
-5.97%
jan 1, 2005
21.798
+0.899
4.3%
jan 1, 2006
22.336
+0.538
2.47%
jan 1, 2007
22.467
+0.131
0.59%
jan 1, 2008
22.673
+0.206
0.92%
jan 1, 2009
23.675
+1.001
4.42%
jan 1, 2010
24.605
+0.93
3.93%
jan 1, 2011
23.017
-1.588
-6.45%
jan 1, 2012
23.617
+0.601
2.61%
jan 1, 2013
23.165
-0.452
-1.91%
jan 1, 2014
23.058
-0.107
-0.46%
jan 1, 2015
21.966
-1.092
-4.74%
Ranking of countries by current statistics by years


Comments: