29
/
en
AIzaSyAYiBZKx7MnpbEhh9jyipgxe19OcubqV5w
April 1, 2024
245355
South Africa
ZAF
true
2
1
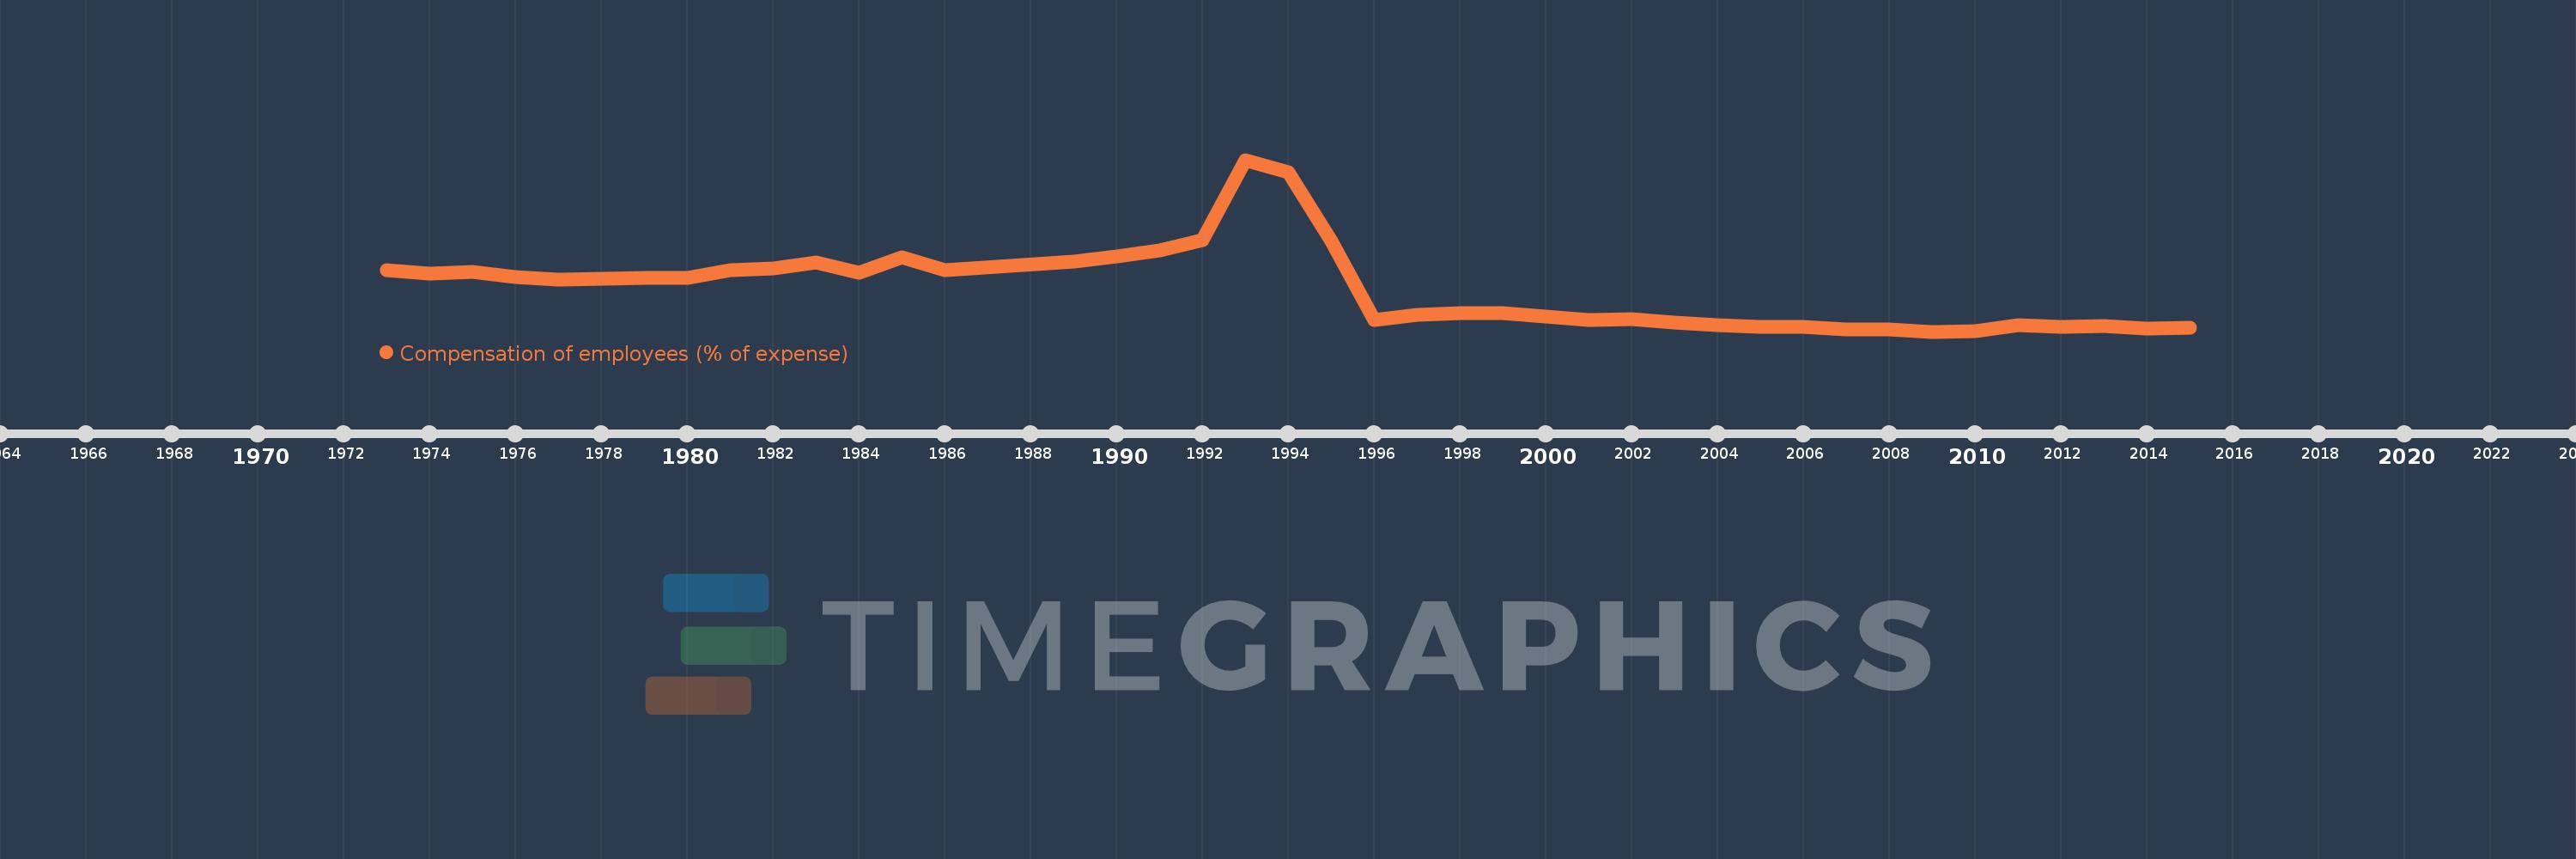
Compensation of employees (% of expense)
2015,2014,2013,2012,2011,2010,2009,2008,2007,2006,2005,2004,2003,2002,2001,2000,1999,1998,1997,1996,1995,1994,1993,1992,1991,1990,1989,1986,1985,1984,1983,1982,1981,1980,1979,1978,1977,1976,1975,1974,1973
This statistics in other country:
AfghanistanAlbaniaAlgeriaAngolaAntigua and BarbudaArab WorldArmeniaAustraliaAustriaAzerbaijanBahamas, TheBahrainBangladeshBarbadosBelarusBelgiumBelizeBeninBhutanBoliviaBosnia and HerzegovinaBotswanaBrazilBulgariaBurkina FasoBurundiCabo VerdeCambodiaCanadaCaribbean small statesCentral African RepublicCentral Europe and the BalticsChileColombiaCongo, Dem. Rep.Congo, Rep.Costa RicaCote d'IvoireCroatiaCyprusCzech RepublicDenmarkDominicaDominican RepublicEarly-demographic dividendEast Asia & PacificEast Asia & Pacific (excluding high income)East Asia & Pacific (IDA & IBRD countries)Egypt, Arab Rep.El SalvadorEquatorial GuineaEstoniaEthiopiaEuro areaEurope & Central AsiaEurope & Central Asia (excluding high income)Europe & Central Asia (IDA & IBRD countries)European UnionFijiFinlandFranceGambia, TheGeorgiaGermanyGhanaGreeceGrenadaGuatemalaHeavily indebted poor countries (HIPC)High incomeHondurasHong Kong SAR, ChinaHungaryIBRD onlyIcelandIDA & IBRD totalIDA blendIDA onlyIDA totalIndiaIndonesiaIran, Islamic Rep.IraqIrelandIsraelItalyJamaicaJapanJordanKazakhstanKenyaKiribatiKorea, Rep.KuwaitKyrgyz RepublicLao PDRLate-demographic dividendLatin America & Caribbean Latin America & Caribbean (excluding high income)Latin America & the Caribbean (IDA & IBRD countries)LatviaLeast developed countries: UN classificationLebanonLesothoLiberiaLithuaniaLow & middle incomeLow incomeLower middle incomeLuxembourgMacao SAR, ChinaMacedonia, FYRMadagascarMalawiMalaysiaMaldivesMaliMaltaMauritiusMexicoMicronesia, Fed. Sts.Middle East & North AfricaMiddle East & North Africa (excluding high income)Middle East & North Africa (IDA & IBRD countries)Middle incomeMoldovaMongoliaMoroccoMozambiqueNamibiaNepalNetherlandsNew ZealandNicaraguaNigeriaNorth AmericaNorwayOECD membersOmanOther small statesPakistanPanamaPapua New GuineaParaguayPeruPhilippinesPolandPortugalPost-demographic dividendPre-demographic dividendQatarRomaniaRussian FederationRwandaSamoaSan MarinoSao Tome and PrincipeSenegalSerbiaSeychellesSierra LeoneSingaporeSlovak RepublicSloveniaSmall statesSolomon IslandsSouth AfricaSouth AsiaSouth Asia (IDA & IBRD)SpainSri LankaSt. Kitts and NevisSt. LuciaSub-Saharan Africa Sub-Saharan Africa (excluding high income)Sub-Saharan Africa (IDA & IBRD countries)SurinameSwazilandSwedenSwitzerlandSyrian Arab RepublicTajikistanTanzaniaThailandTimor-LesteTogoTrinidad and TobagoTunisiaTurkeyUgandaUkraineUnited Arab EmiratesUnited KingdomUnited StatesUpper middle incomeUruguayVanuatuVenezuela, RBWest Bank and GazaWorldYemen, Rep.ZambiaZimbabwe Timeline:
This timeline shows a graph from 1973 to 2015 of South Africa. No data until 1972. Number of actual observations by date: 41.
Source name:
World Development Indicators
Source organization:
International Monetary Fund, Government Finance Statistics Yearbook and data files.
Categories, topics:
Public Sector
Last updated:
apr 23, 2017
Indicators value changes by year
Minimum:
13.376
jan 1, 2009
Maximum:
45.264
jan 1, 1993
At the date of observation
Value
Absolute change
Change from previous value
jan 1, 1973
24.846
+24.846
0.0%
jan 1, 1974
24.182
-0.664
-2.67%
jan 1, 1975
24.379
+0.198
0.82%
jan 1, 1976
23.524
-0.855
-3.51%
jan 1, 1977
23.077
-0.447
-1.9%
jan 1, 1978
23.173
+0.096
0.42%
jan 1, 1979
23.396
+0.223
0.96%
jan 1, 1980
23.34
-0.056
-0.24%
jan 1, 1981
24.768
+1.428
6.12%
jan 1, 1982
25.034
+0.266
1.07%
jan 1, 1983
26.249
+1.215
4.85%
jan 1, 1984
24.268
-1.981
-7.55%
jan 1, 1985
27.123
+2.855
11.76%
jan 1, 1986
24.812
-2.311
-8.52%
jan 1, 1989
26.312
+1.5
6.04%
jan 1, 1990
27.398
+1.086
4.13%
jan 1, 1991
28.463
+1.065
3.89%
jan 1, 1992
30.394
+1.932
6.79%
jan 1, 1993
45.264
+14.87
48.92%
jan 1, 1994
43.012
-2.252
-4.98%
jan 1, 1995
30.27
-12.742
-29.62%
jan 1, 1996
15.607
-14.663
-48.44%
jan 1, 1997
16.426
+0.818
5.24%
jan 1, 1998
16.81
+0.385
2.34%
jan 1, 1999
16.738
-0.072
-0.43%
jan 1, 2000
16.187
-0.55
-3.29%
jan 1, 2001
15.558
-0.63
-3.89%
jan 1, 2002
15.675
+0.117
0.75%
jan 1, 2003
15.02
-0.655
-4.18%
jan 1, 2004
14.604
-0.416
-2.77%
jan 1, 2005
14.231
-0.373
-2.55%
jan 1, 2006
14.307
+0.076
0.53%
jan 1, 2007
13.806
-0.501
-3.5%
jan 1, 2008
13.773
-0.034
-0.24%
jan 1, 2009
13.376
-0.397
-2.88%
jan 1, 2010
13.443
+0.067
0.5%
jan 1, 2011
14.513
+1.07
7.96%
jan 1, 2012
14.195
-0.318
-2.19%
jan 1, 2013
14.437
+0.242
1.7%
jan 1, 2014
13.928
-0.508
-3.52%
jan 1, 2015
14.045
+0.117
0.84%
Ranking of countries by current statistics by years


Comments: