29
/
en
AIzaSyAYiBZKx7MnpbEhh9jyipgxe19OcubqV5w
April 1, 2024
154367
India
IND
true
2
1
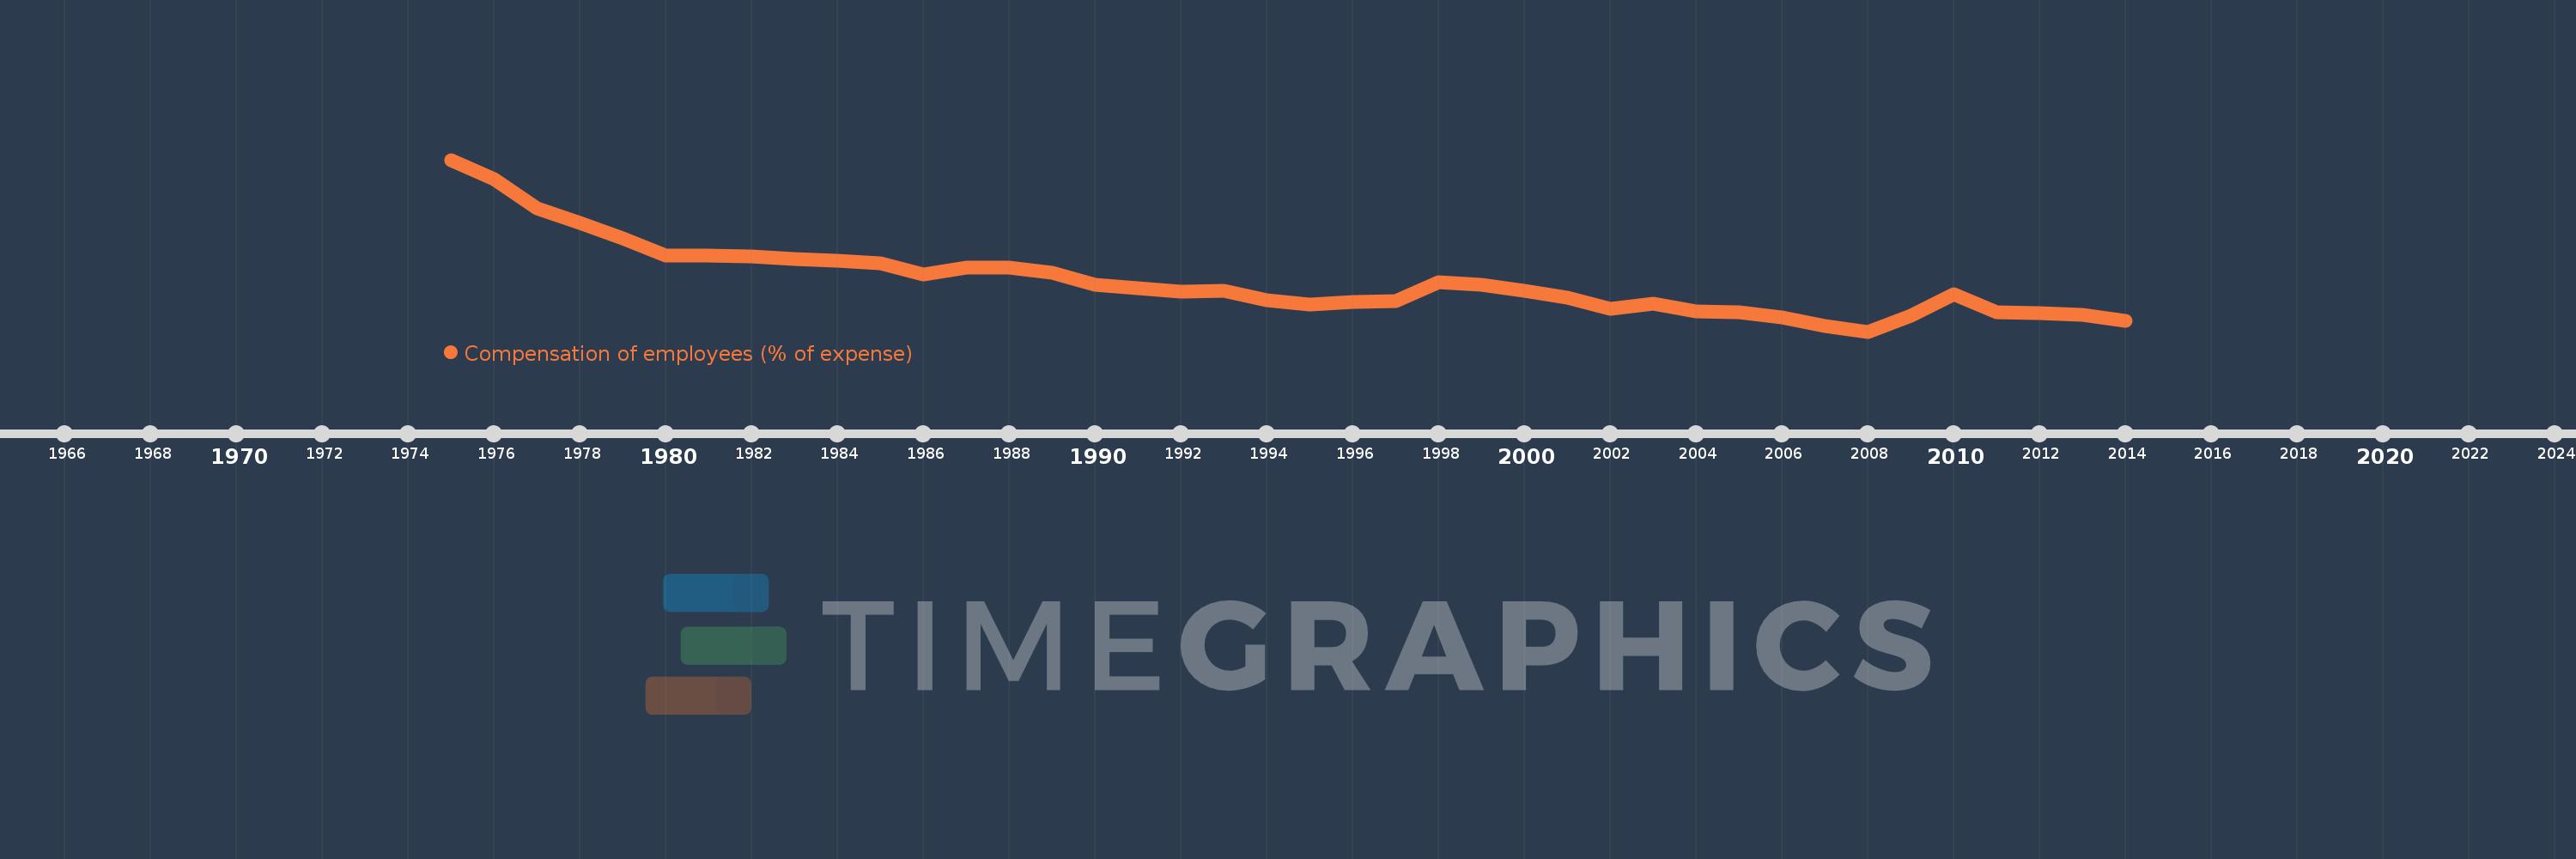
Compensation of employees (% of expense)
2014,2013,2012,2011,2010,2009,2008,2007,2006,2005,2004,2003,2002,2001,2000,1999,1998,1997,1996,1995,1994,1993,1992,1991,1990,1989,1988,1987,1986,1985,1984,1983,1982,1981,1980,1979,1978,1977,1976,1975
This statistics in other country:
AfghanistanAlbaniaAlgeriaAngolaAntigua and BarbudaArab WorldArmeniaAustraliaAustriaAzerbaijanBahamas, TheBahrainBangladeshBarbadosBelarusBelgiumBelizeBeninBhutanBoliviaBosnia and HerzegovinaBotswanaBrazilBulgariaBurkina FasoBurundiCabo VerdeCambodiaCanadaCaribbean small statesCentral African RepublicCentral Europe and the BalticsChileColombiaCongo, Dem. Rep.Congo, Rep.Costa RicaCote d'IvoireCroatiaCyprusCzech RepublicDenmarkDominicaDominican RepublicEarly-demographic dividendEast Asia & PacificEast Asia & Pacific (excluding high income)East Asia & Pacific (IDA & IBRD countries)Egypt, Arab Rep.El SalvadorEquatorial GuineaEstoniaEthiopiaEuro areaEurope & Central AsiaEurope & Central Asia (excluding high income)Europe & Central Asia (IDA & IBRD countries)European UnionFijiFinlandFranceGambia, TheGeorgiaGermanyGhanaGreeceGrenadaGuatemalaHeavily indebted poor countries (HIPC)High incomeHondurasHong Kong SAR, ChinaHungaryIBRD onlyIcelandIDA & IBRD totalIDA blendIDA onlyIDA totalIndiaIndonesiaIran, Islamic Rep.IraqIrelandIsraelItalyJamaicaJapanJordanKazakhstanKenyaKiribatiKorea, Rep.KuwaitKyrgyz RepublicLao PDRLate-demographic dividendLatin America & Caribbean Latin America & Caribbean (excluding high income)Latin America & the Caribbean (IDA & IBRD countries)LatviaLeast developed countries: UN classificationLebanonLesothoLiberiaLithuaniaLow & middle incomeLow incomeLower middle incomeLuxembourgMacao SAR, ChinaMacedonia, FYRMadagascarMalawiMalaysiaMaldivesMaliMaltaMauritiusMexicoMicronesia, Fed. Sts.Middle East & North AfricaMiddle East & North Africa (excluding high income)Middle East & North Africa (IDA & IBRD countries)Middle incomeMoldovaMongoliaMoroccoMozambiqueNamibiaNepalNetherlandsNew ZealandNicaraguaNigeriaNorth AmericaNorwayOECD membersOmanOther small statesPakistanPanamaPapua New GuineaParaguayPeruPhilippinesPolandPortugalPost-demographic dividendPre-demographic dividendQatarRomaniaRussian FederationRwandaSamoaSan MarinoSao Tome and PrincipeSenegalSerbiaSeychellesSierra LeoneSingaporeSlovak RepublicSloveniaSmall statesSolomon IslandsSouth AfricaSouth AsiaSouth Asia (IDA & IBRD)SpainSri LankaSt. Kitts and NevisSt. LuciaSub-Saharan Africa Sub-Saharan Africa (excluding high income)Sub-Saharan Africa (IDA & IBRD countries)SurinameSwazilandSwedenSwitzerlandSyrian Arab RepublicTajikistanTanzaniaThailandTimor-LesteTogoTrinidad and TobagoTunisiaTurkeyUgandaUkraineUnited Arab EmiratesUnited KingdomUnited StatesUpper middle incomeUruguayVanuatuVenezuela, RBWest Bank and GazaWorldYemen, Rep.ZambiaZimbabwe Timeline:
This timeline shows a graph from 1975 to 2014 of India. No data until 1974. Number of actual observations by date: 40.
Source name:
World Development Indicators
Source organization:
International Monetary Fund, Government Finance Statistics Yearbook and data files.
Categories, topics:
Public Sector
Last updated:
apr 23, 2017
Indicators value changes by year
At the date of observation
Value
Absolute change
Change from previous value
jan 1, 1975
23.37
+23.37
0.0%
jan 1, 1976
21.539
-1.831
-7.84%
jan 1, 1977
18.803
-2.736
-12.7%
jan 1, 1978
17.405
-1.398
-7.44%
jan 1, 1979
15.916
-1.489
-8.55%
jan 1, 1980
14.248
-1.668
-10.48%
jan 1, 1981
14.282
+0.034
0.24%
jan 1, 1982
14.2
-0.082
-0.58%
jan 1, 1983
13.945
-0.255
-1.8%
jan 1, 1984
13.802
-0.142
-1.02%
jan 1, 1985
13.525
-0.277
-2.01%
jan 1, 1986
12.451
-1.075
-7.95%
jan 1, 1987
13.18
+0.729
5.85%
jan 1, 1988
13.138
-0.042
-0.32%
jan 1, 1989
12.648
-0.49
-3.73%
jan 1, 1990
11.528
-1.12
-8.86%
jan 1, 1991
11.176
-0.351
-3.05%
jan 1, 1992
10.896
-0.28
-2.51%
jan 1, 1993
10.971
+0.075
0.69%
jan 1, 1994
10.068
-0.903
-8.23%
jan 1, 1995
9.661
-0.407
-4.04%
jan 1, 1996
9.919
+0.259
2.68%
jan 1, 1997
9.954
+0.034
0.35%
jan 1, 1998
11.768
+1.815
18.23%
jan 1, 1999
11.51
-0.258
-2.19%
jan 1, 2000
10.925
-0.585
-5.08%
jan 1, 2001
10.269
-0.656
-6.01%
jan 1, 2002
9.232
-1.037
-10.1%
jan 1, 2003
9.717
+0.485
5.25%
jan 1, 2004
9.002
-0.715
-7.36%
jan 1, 2005
8.877
-0.125
-1.39%
jan 1, 2006
8.432
-0.445
-5.01%
jan 1, 2007
7.635
-0.797
-9.45%
jan 1, 2008
7.069
-0.566
-7.41%
jan 1, 2009
8.589
+1.52
21.5%
jan 1, 2010
10.634
+2.045
23.81%
jan 1, 2011
8.881
-1.753
-16.48%
jan 1, 2012
8.841
-0.041
-0.46%
jan 1, 2013
8.627
-0.214
-2.42%
jan 1, 2014
8.128
-0.498
-5.78%
Ranking of countries by current statistics by years


Comments: