29
/
en
AIzaSyAYiBZKx7MnpbEhh9jyipgxe19OcubqV5w
April 1, 2024
132970
Finland
FIN
true
2
1
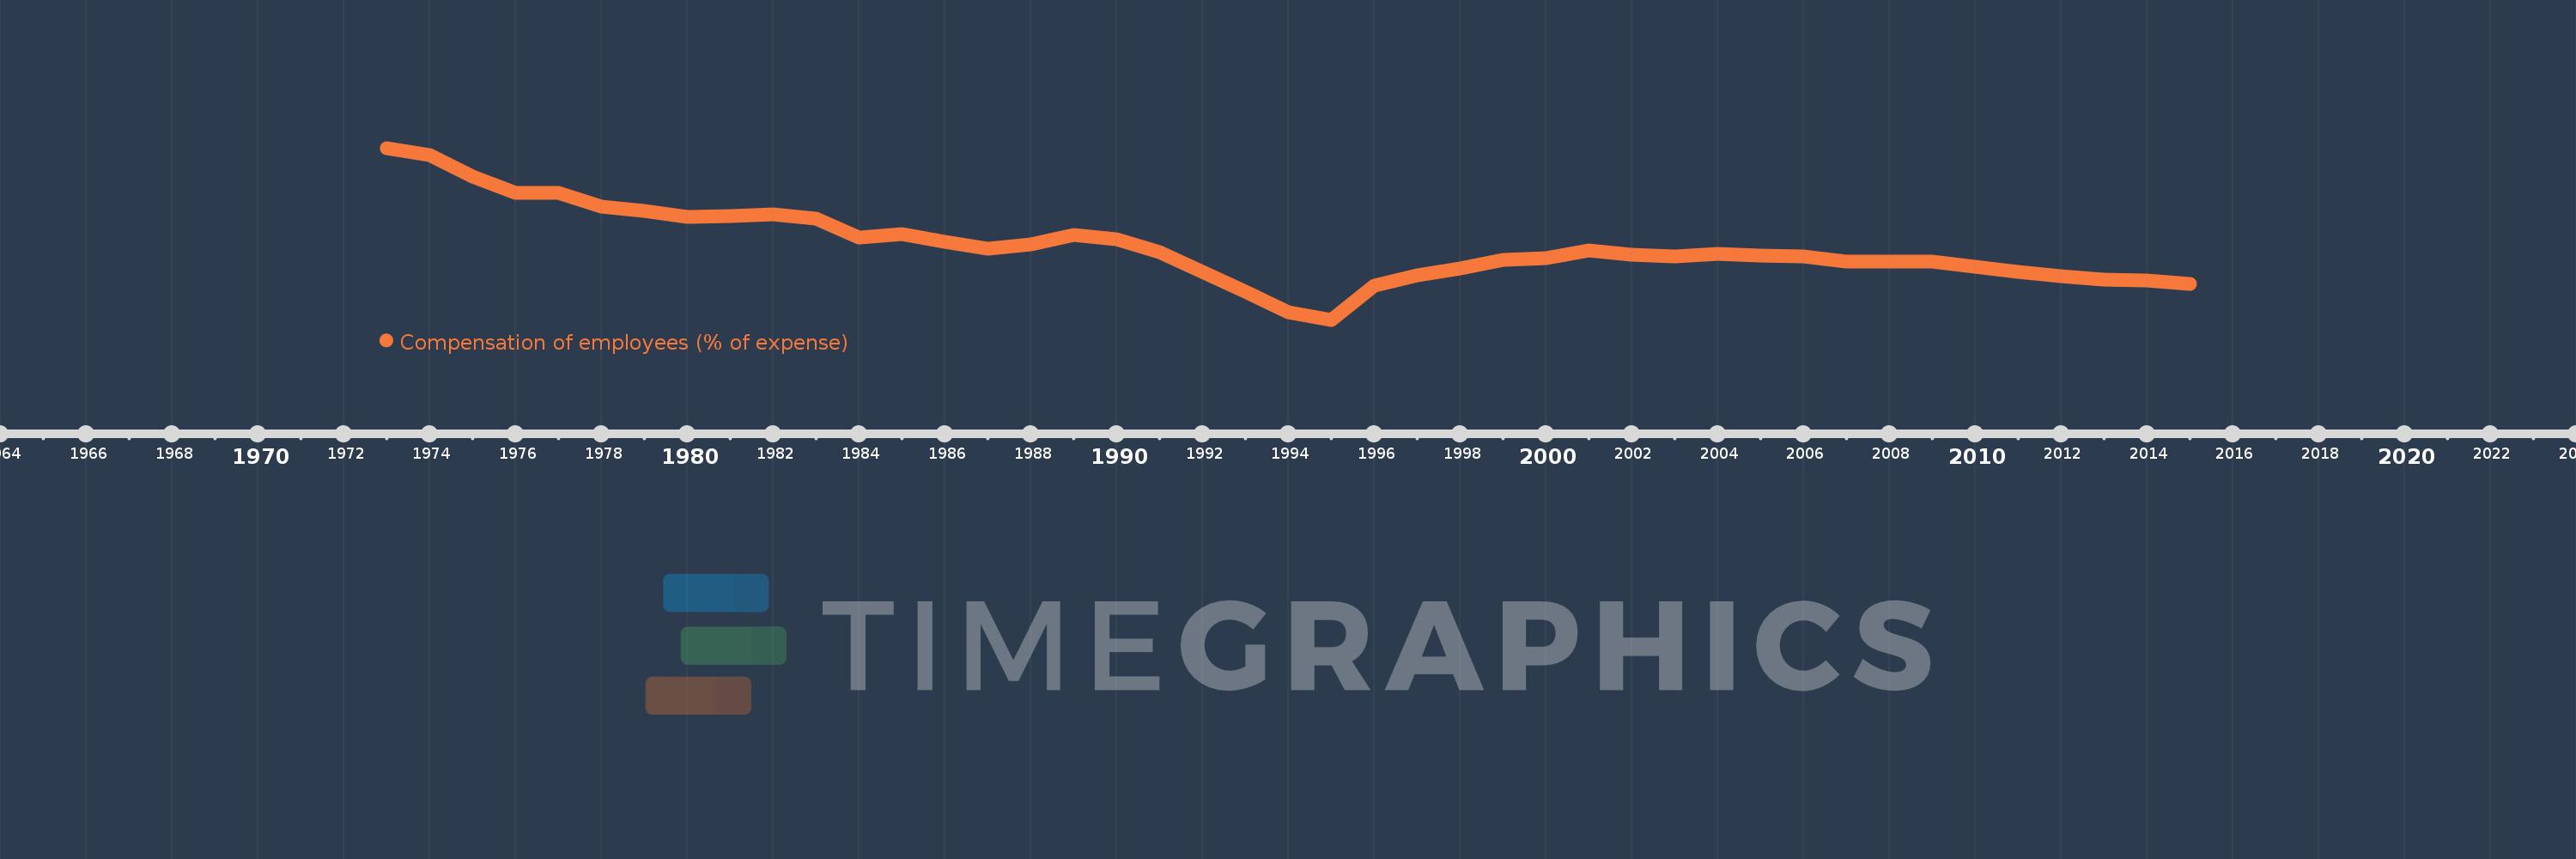
Compensation of employees (% of expense)
2015,2014,2013,2012,2011,2010,2009,2008,2007,2006,2005,2004,2003,2002,2001,2000,1999,1998,1997,1996,1995,1994,1993,1992,1991,1990,1989,1988,1987,1986,1985,1984,1983,1982,1981,1980,1979,1978,1977,1976,1975,1974,1973
This statistics in other country:
AfghanistanAlbaniaAlgeriaAngolaAntigua and BarbudaArab WorldArmeniaAustraliaAustriaAzerbaijanBahamas, TheBahrainBangladeshBarbadosBelarusBelgiumBelizeBeninBhutanBoliviaBosnia and HerzegovinaBotswanaBrazilBulgariaBurkina FasoBurundiCabo VerdeCambodiaCanadaCaribbean small statesCentral African RepublicCentral Europe and the BalticsChileColombiaCongo, Dem. Rep.Congo, Rep.Costa RicaCote d'IvoireCroatiaCyprusCzech RepublicDenmarkDominicaDominican RepublicEarly-demographic dividendEast Asia & PacificEast Asia & Pacific (excluding high income)East Asia & Pacific (IDA & IBRD countries)Egypt, Arab Rep.El SalvadorEquatorial GuineaEstoniaEthiopiaEuro areaEurope & Central AsiaEurope & Central Asia (excluding high income)Europe & Central Asia (IDA & IBRD countries)European UnionFijiFinlandFranceGambia, TheGeorgiaGermanyGhanaGreeceGrenadaGuatemalaHeavily indebted poor countries (HIPC)High incomeHondurasHong Kong SAR, ChinaHungaryIBRD onlyIcelandIDA & IBRD totalIDA blendIDA onlyIDA totalIndiaIndonesiaIran, Islamic Rep.IraqIrelandIsraelItalyJamaicaJapanJordanKazakhstanKenyaKiribatiKorea, Rep.KuwaitKyrgyz RepublicLao PDRLate-demographic dividendLatin America & Caribbean Latin America & Caribbean (excluding high income)Latin America & the Caribbean (IDA & IBRD countries)LatviaLeast developed countries: UN classificationLebanonLesothoLiberiaLithuaniaLow & middle incomeLow incomeLower middle incomeLuxembourgMacao SAR, ChinaMacedonia, FYRMadagascarMalawiMalaysiaMaldivesMaliMaltaMauritiusMexicoMicronesia, Fed. Sts.Middle East & North AfricaMiddle East & North Africa (excluding high income)Middle East & North Africa (IDA & IBRD countries)Middle incomeMoldovaMongoliaMoroccoMozambiqueNamibiaNepalNetherlandsNew ZealandNicaraguaNigeriaNorth AmericaNorwayOECD membersOmanOther small statesPakistanPanamaPapua New GuineaParaguayPeruPhilippinesPolandPortugalPost-demographic dividendPre-demographic dividendQatarRomaniaRussian FederationRwandaSamoaSan MarinoSao Tome and PrincipeSenegalSerbiaSeychellesSierra LeoneSingaporeSlovak RepublicSloveniaSmall statesSolomon IslandsSouth AfricaSouth AsiaSouth Asia (IDA & IBRD)SpainSri LankaSt. Kitts and NevisSt. LuciaSub-Saharan Africa Sub-Saharan Africa (excluding high income)Sub-Saharan Africa (IDA & IBRD countries)SurinameSwazilandSwedenSwitzerlandSyrian Arab RepublicTajikistanTanzaniaThailandTimor-LesteTogoTrinidad and TobagoTunisiaTurkeyUgandaUkraineUnited Arab EmiratesUnited KingdomUnited StatesUpper middle incomeUruguayVanuatuVenezuela, RBWest Bank and GazaWorldYemen, Rep.ZambiaZimbabwe Timeline:
This timeline shows a graph from 1973 to 2015 of Finland. No data until 1972. Number of actual observations by date: 43.
Source name:
World Development Indicators
Source organization:
International Monetary Fund, Government Finance Statistics Yearbook and data files.
Categories, topics:
Public Sector
Last updated:
apr 23, 2017
Indicators value changes by year
Maximum:
14.997
jan 1, 1973
At the date of observation
Value
Absolute change
Change from previous value
jan 1, 1973
14.997
+14.997
0.0%
jan 1, 1974
14.655
-0.342
-2.28%
jan 1, 1975
13.678
-0.977
-6.66%
jan 1, 1976
12.93
-0.748
-5.47%
jan 1, 1977
12.945
+0.015
0.11%
jan 1, 1978
12.314
-0.631
-4.88%
jan 1, 1979
12.088
-0.226
-1.83%
jan 1, 1980
11.824
-0.264
-2.19%
jan 1, 1981
11.883
+0.059
0.5%
jan 1, 1982
11.951
+0.068
0.57%
jan 1, 1983
11.754
-0.197
-1.65%
jan 1, 1984
10.866
-0.888
-7.55%
jan 1, 1985
11.026
+0.16
1.47%
jan 1, 1986
10.707
-0.319
-2.89%
jan 1, 1987
10.357
-0.35
-3.27%
jan 1, 1988
10.588
+0.231
2.23%
jan 1, 1989
11.004
+0.416
3.93%
jan 1, 1990
10.812
-0.192
-1.75%
jan 1, 1991
10.208
-0.604
-5.59%
jan 1, 1992
9.326
-0.882
-8.64%
jan 1, 1993
8.383
-0.943
-10.11%
jan 1, 1994
7.447
-0.937
-11.17%
jan 1, 1995
7.111
-0.336
-4.52%
jan 1, 1996
8.671
+1.56
21.94%
jan 1, 1997
9.144
+0.473
5.46%
jan 1, 1998
9.452
+0.308
3.37%
jan 1, 1999
9.857
+0.405
4.28%
jan 1, 2000
9.942
+0.086
0.87%
jan 1, 2001
10.297
+0.355
3.57%
jan 1, 2002
10.105
-0.192
-1.87%
jan 1, 2003
10.011
-0.094
-0.93%
jan 1, 2004
10.137
+0.126
1.26%
jan 1, 2005
10.055
-0.081
-0.8%
jan 1, 2006
10.009
-0.047
-0.46%
jan 1, 2007
9.791
-0.217
-2.17%
jan 1, 2008
9.768
-0.023
-0.24%
jan 1, 2009
9.764
-0.004
-0.04%
jan 1, 2010
9.548
-0.216
-2.21%
jan 1, 2011
9.306
-0.242
-2.53%
jan 1, 2012
9.11
-0.196
-2.11%
jan 1, 2013
8.958
-0.152
-1.67%
jan 1, 2014
8.931
-0.026
-0.3%
jan 1, 2015
8.765
-0.166
-1.86%
Ranking of countries by current statistics by years


Comments: