29
/
en
AIzaSyAYiBZKx7MnpbEhh9jyipgxe19OcubqV5w
April 1, 2024
152337
Hungary
HUN
true
2
1
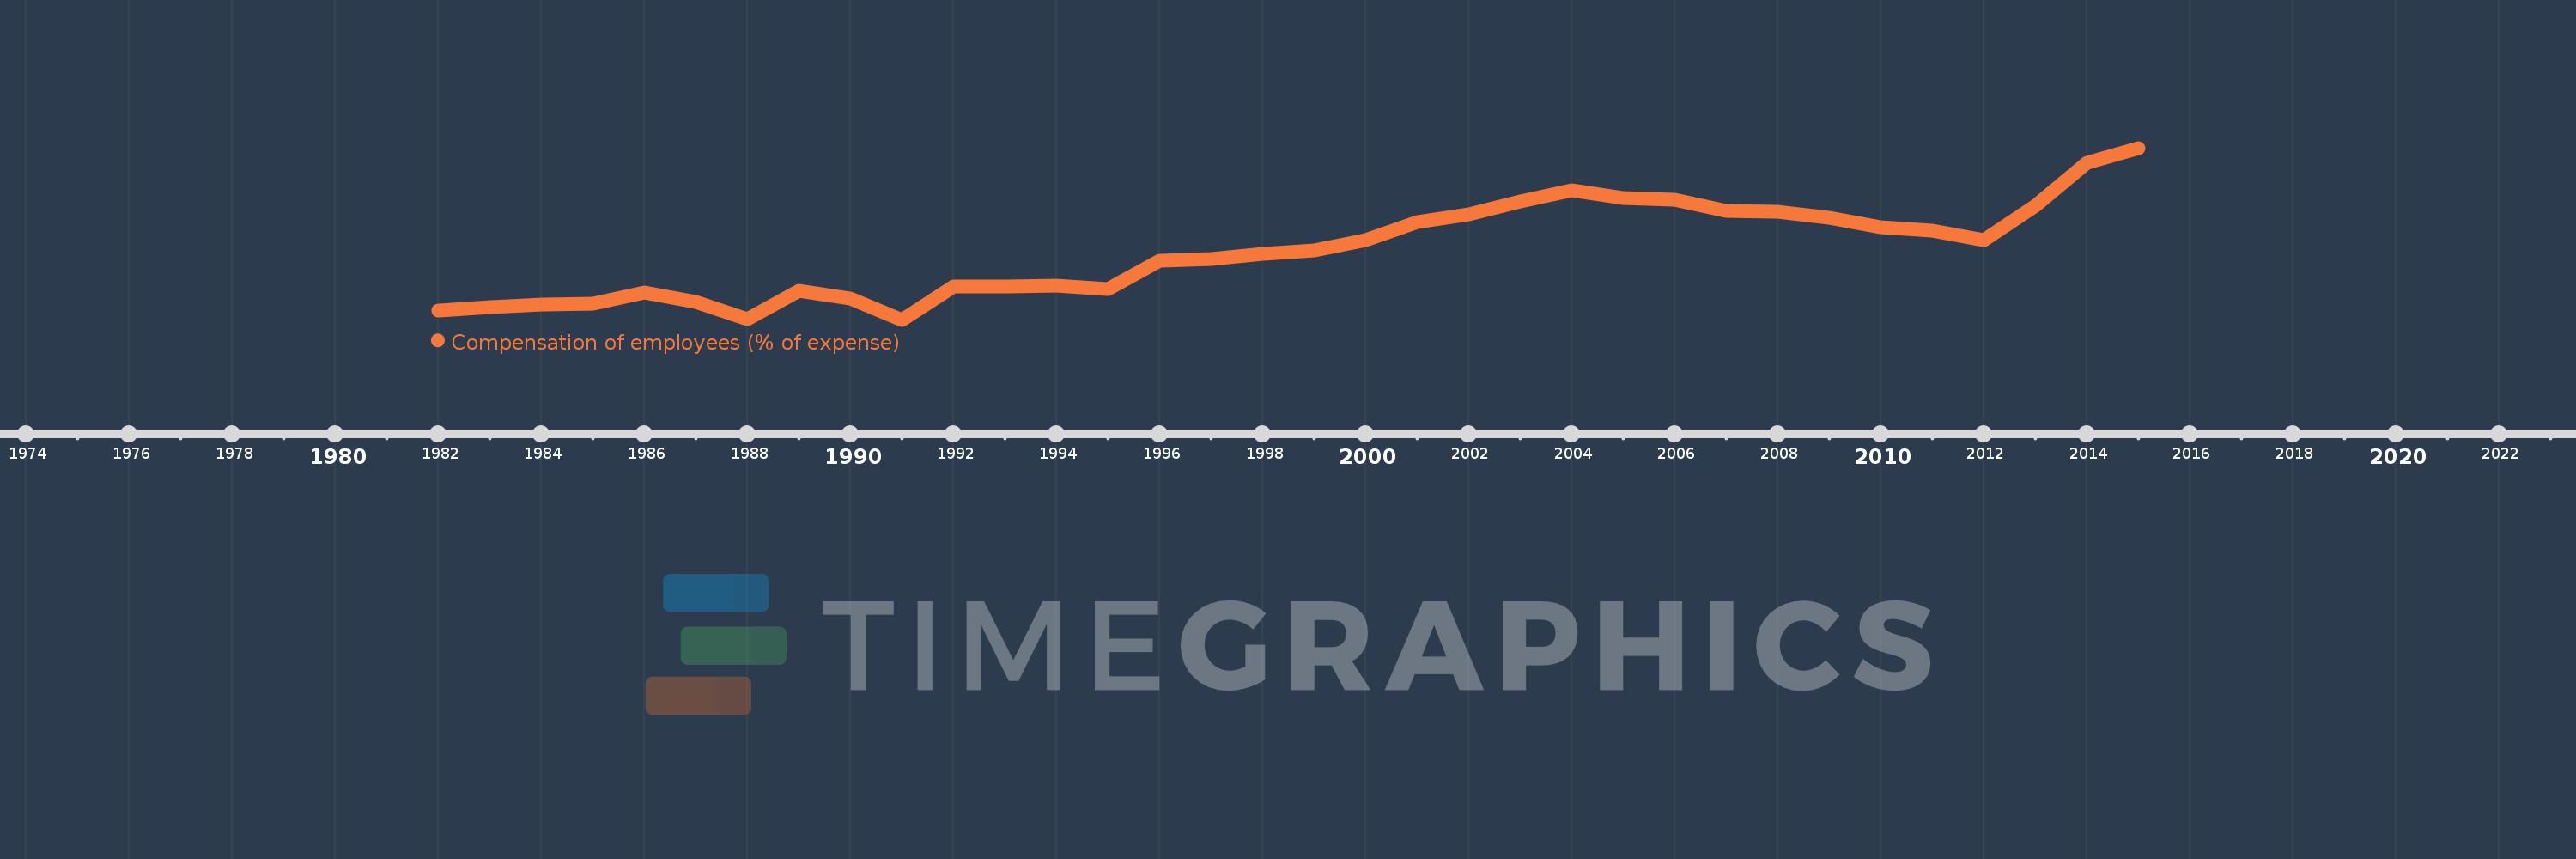
Compensation of employees (% of expense)
2015,2014,2013,2012,2011,2010,2009,2008,2007,2006,2005,2004,2003,2002,2001,2000,1999,1998,1997,1996,1995,1994,1993,1992,1991,1990,1989,1988,1987,1986,1985,1984,1983,1982
This statistics in other country:
AfghanistanAlbaniaAlgeriaAngolaAntigua and BarbudaArab WorldArmeniaAustraliaAustriaAzerbaijanBahamas, TheBahrainBangladeshBarbadosBelarusBelgiumBelizeBeninBhutanBoliviaBosnia and HerzegovinaBotswanaBrazilBulgariaBurkina FasoBurundiCabo VerdeCambodiaCanadaCaribbean small statesCentral African RepublicCentral Europe and the BalticsChileColombiaCongo, Dem. Rep.Congo, Rep.Costa RicaCote d'IvoireCroatiaCyprusCzech RepublicDenmarkDominicaDominican RepublicEarly-demographic dividendEast Asia & PacificEast Asia & Pacific (excluding high income)East Asia & Pacific (IDA & IBRD countries)Egypt, Arab Rep.El SalvadorEquatorial GuineaEstoniaEthiopiaEuro areaEurope & Central AsiaEurope & Central Asia (excluding high income)Europe & Central Asia (IDA & IBRD countries)European UnionFijiFinlandFranceGambia, TheGeorgiaGermanyGhanaGreeceGrenadaGuatemalaHeavily indebted poor countries (HIPC)High incomeHondurasHong Kong SAR, ChinaHungaryIBRD onlyIcelandIDA & IBRD totalIDA blendIDA onlyIDA totalIndiaIndonesiaIran, Islamic Rep.IraqIrelandIsraelItalyJamaicaJapanJordanKazakhstanKenyaKiribatiKorea, Rep.KuwaitKyrgyz RepublicLao PDRLate-demographic dividendLatin America & Caribbean Latin America & Caribbean (excluding high income)Latin America & the Caribbean (IDA & IBRD countries)LatviaLeast developed countries: UN classificationLebanonLesothoLiberiaLithuaniaLow & middle incomeLow incomeLower middle incomeLuxembourgMacao SAR, ChinaMacedonia, FYRMadagascarMalawiMalaysiaMaldivesMaliMaltaMauritiusMexicoMicronesia, Fed. Sts.Middle East & North AfricaMiddle East & North Africa (excluding high income)Middle East & North Africa (IDA & IBRD countries)Middle incomeMoldovaMongoliaMoroccoMozambiqueNamibiaNepalNetherlandsNew ZealandNicaraguaNigeriaNorth AmericaNorwayOECD membersOmanOther small statesPakistanPanamaPapua New GuineaParaguayPeruPhilippinesPolandPortugalPost-demographic dividendPre-demographic dividendQatarRomaniaRussian FederationRwandaSamoaSan MarinoSao Tome and PrincipeSenegalSerbiaSeychellesSierra LeoneSingaporeSlovak RepublicSloveniaSmall statesSolomon IslandsSouth AfricaSouth AsiaSouth Asia (IDA & IBRD)SpainSri LankaSt. Kitts and NevisSt. LuciaSub-Saharan Africa Sub-Saharan Africa (excluding high income)Sub-Saharan Africa (IDA & IBRD countries)SurinameSwazilandSwedenSwitzerlandSyrian Arab RepublicTajikistanTanzaniaThailandTimor-LesteTogoTrinidad and TobagoTunisiaTurkeyUgandaUkraineUnited Arab EmiratesUnited KingdomUnited StatesUpper middle incomeUruguayVanuatuVenezuela, RBWest Bank and GazaWorldYemen, Rep.ZambiaZimbabwe Timeline:
This timeline shows a graph from 1982 to 2015 of Hungary. No data until 1981. Number of actual observations by date: 34.
Source name:
World Development Indicators
Source organization:
International Monetary Fund, Government Finance Statistics Yearbook and data files.
Categories, topics:
Public Sector
Last updated:
apr 23, 2017
Indicators value changes by year
Maximum:
17.396
jan 1, 2015
At the date of observation
Value
Absolute change
Change from previous value
jan 1, 1982
7.131
+7.131
0.0%
jan 1, 1983
7.346
+0.215
3.01%
jan 1, 1984
7.541
+0.195
2.66%
jan 1, 1985
7.579
+0.038
0.5%
jan 1, 1986
8.281
+0.702
9.27%
jan 1, 1987
7.692
-0.589
-7.11%
jan 1, 1988
6.591
-1.102
-14.32%
jan 1, 1989
8.403
+1.813
27.51%
jan 1, 1990
7.917
-0.486
-5.78%
jan 1, 1991
6.561
-1.356
-17.13%
jan 1, 1992
8.667
+2.106
32.09%
jan 1, 1993
8.665
-0.001
-0.02%
jan 1, 1994
8.688
+0.022
0.26%
jan 1, 1995
8.517
-0.171
-1.97%
jan 1, 1996
10.298
+1.782
20.92%
jan 1, 1997
10.407
+0.109
1.06%
jan 1, 1998
10.743
+0.335
3.22%
jan 1, 1999
10.917
+0.174
1.62%
jan 1, 2000
11.558
+0.641
5.87%
jan 1, 2001
12.703
+1.145
9.9%
jan 1, 2002
13.222
+0.519
4.09%
jan 1, 2003
14.016
+0.793
6.0%
jan 1, 2004
14.708
+0.692
4.94%
jan 1, 2005
14.254
-0.453
-3.08%
jan 1, 2006
14.122
-0.132
-0.93%
jan 1, 2007
13.4
-0.722
-5.11%
jan 1, 2008
13.368
-0.032
-0.24%
jan 1, 2009
12.995
-0.373
-2.79%
jan 1, 2010
12.403
-0.592
-4.55%
jan 1, 2011
12.183
-0.22
-1.77%
jan 1, 2012
11.569
-0.614
-5.04%
jan 1, 2013
13.736
+2.167
18.73%
jan 1, 2014
16.483
+2.747
20.0%
jan 1, 2015
17.396
+0.913
5.54%
Ranking of countries by current statistics by years


Comments: