29
/
en
AIzaSyAYiBZKx7MnpbEhh9jyipgxe19OcubqV5w
April 1, 2024
207760
Netherlands
NLD
true
2
1
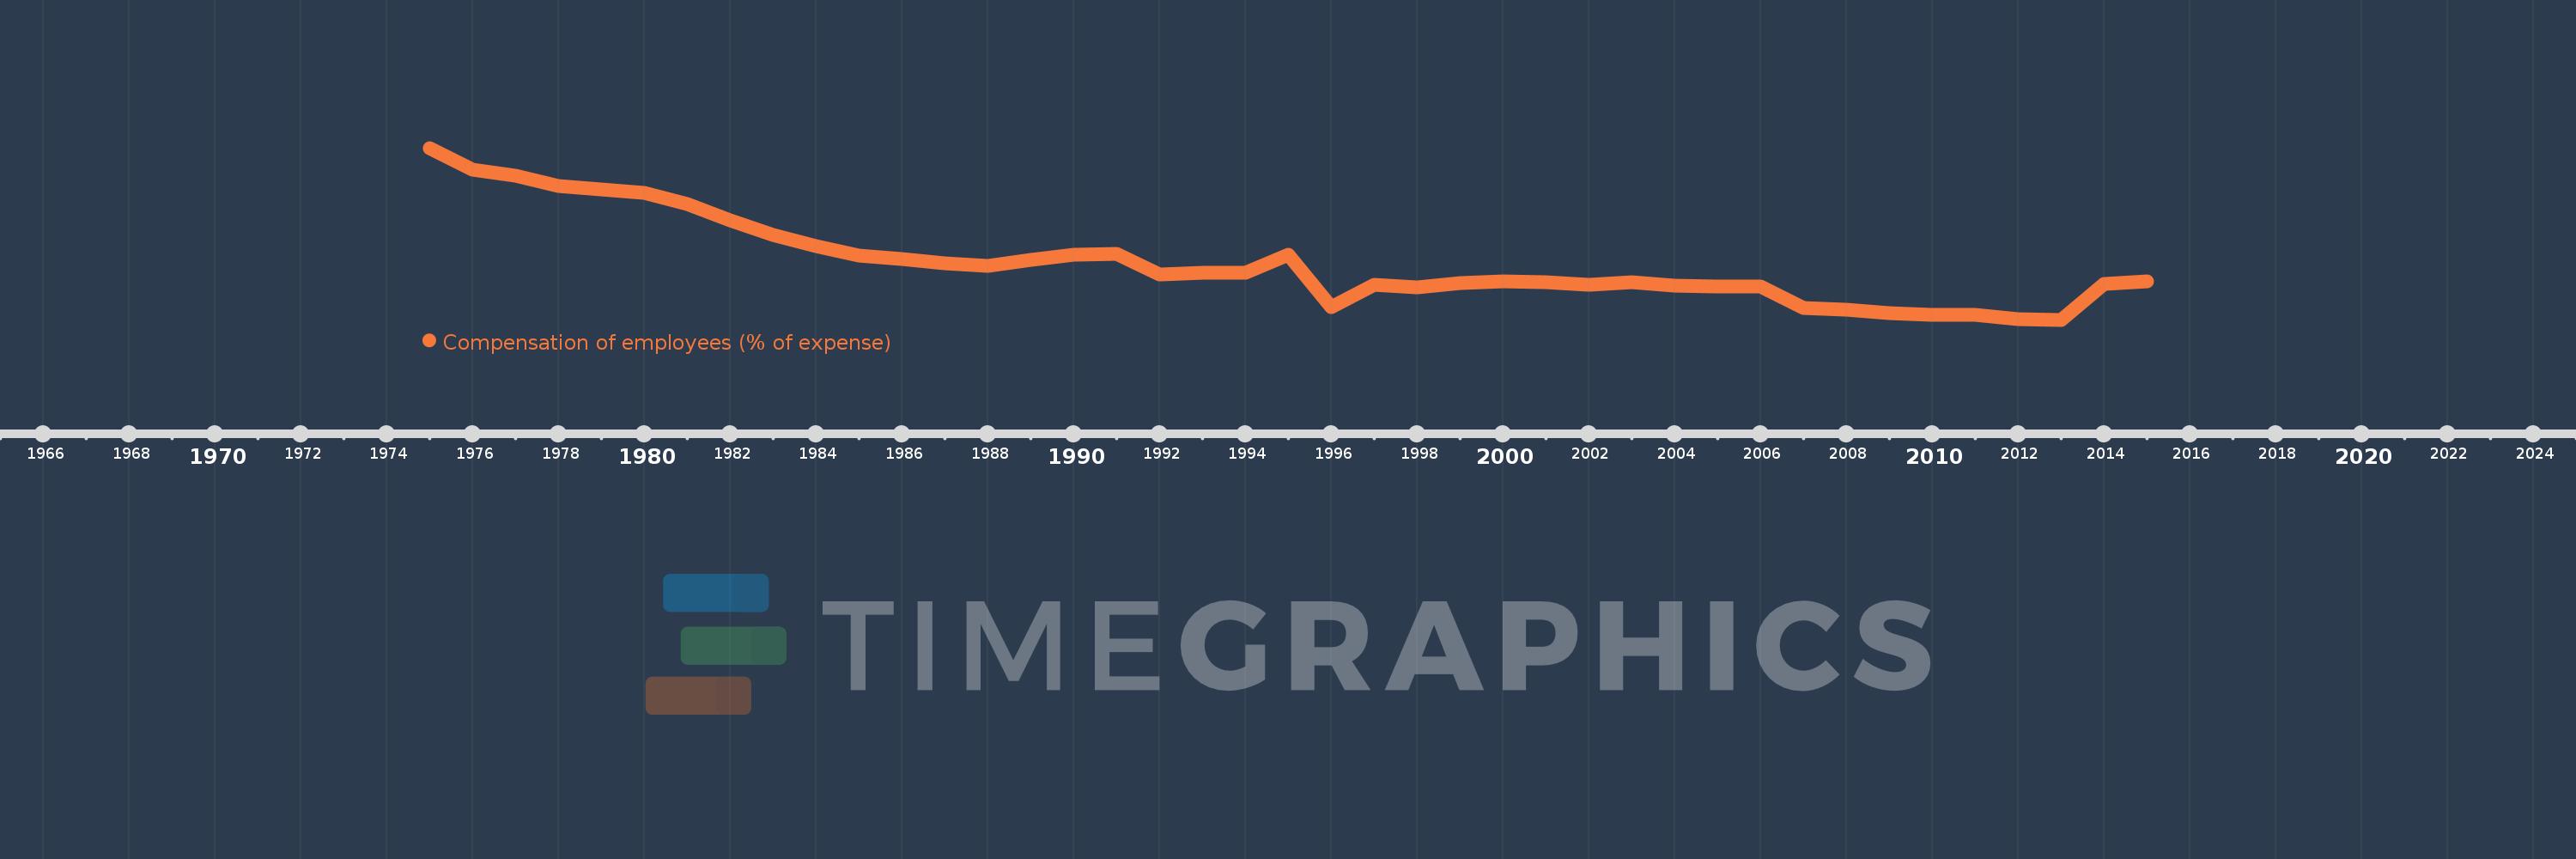
Compensation of employees (% of expense)
2015,2014,2013,2012,2011,2010,2009,2008,2007,2006,2005,2004,2003,2002,2001,2000,1999,1998,1997,1996,1995,1994,1993,1992,1991,1990,1989,1988,1987,1986,1985,1984,1983,1982,1981,1980,1979,1978,1977,1976,1975
This statistics in other country:
AfghanistanAlbaniaAlgeriaAngolaAntigua and BarbudaArab WorldArmeniaAustraliaAustriaAzerbaijanBahamas, TheBahrainBangladeshBarbadosBelarusBelgiumBelizeBeninBhutanBoliviaBosnia and HerzegovinaBotswanaBrazilBulgariaBurkina FasoBurundiCabo VerdeCambodiaCanadaCaribbean small statesCentral African RepublicCentral Europe and the BalticsChileColombiaCongo, Dem. Rep.Congo, Rep.Costa RicaCote d'IvoireCroatiaCyprusCzech RepublicDenmarkDominicaDominican RepublicEarly-demographic dividendEast Asia & PacificEast Asia & Pacific (excluding high income)East Asia & Pacific (IDA & IBRD countries)Egypt, Arab Rep.El SalvadorEquatorial GuineaEstoniaEthiopiaEuro areaEurope & Central AsiaEurope & Central Asia (excluding high income)Europe & Central Asia (IDA & IBRD countries)European UnionFijiFinlandFranceGambia, TheGeorgiaGermanyGhanaGreeceGrenadaGuatemalaHeavily indebted poor countries (HIPC)High incomeHondurasHong Kong SAR, ChinaHungaryIBRD onlyIcelandIDA & IBRD totalIDA blendIDA onlyIDA totalIndiaIndonesiaIran, Islamic Rep.IraqIrelandIsraelItalyJamaicaJapanJordanKazakhstanKenyaKiribatiKorea, Rep.KuwaitKyrgyz RepublicLao PDRLate-demographic dividendLatin America & Caribbean Latin America & Caribbean (excluding high income)Latin America & the Caribbean (IDA & IBRD countries)LatviaLeast developed countries: UN classificationLebanonLesothoLiberiaLithuaniaLow & middle incomeLow incomeLower middle incomeLuxembourgMacao SAR, ChinaMacedonia, FYRMadagascarMalawiMalaysiaMaldivesMaliMaltaMauritiusMexicoMicronesia, Fed. Sts.Middle East & North AfricaMiddle East & North Africa (excluding high income)Middle East & North Africa (IDA & IBRD countries)Middle incomeMoldovaMongoliaMoroccoMozambiqueNamibiaNepalNetherlandsNew ZealandNicaraguaNigeriaNorth AmericaNorwayOECD membersOmanOther small statesPakistanPanamaPapua New GuineaParaguayPeruPhilippinesPolandPortugalPost-demographic dividendPre-demographic dividendQatarRomaniaRussian FederationRwandaSamoaSan MarinoSao Tome and PrincipeSenegalSerbiaSeychellesSierra LeoneSingaporeSlovak RepublicSloveniaSmall statesSolomon IslandsSouth AfricaSouth AsiaSouth Asia (IDA & IBRD)SpainSri LankaSt. Kitts and NevisSt. LuciaSub-Saharan Africa Sub-Saharan Africa (excluding high income)Sub-Saharan Africa (IDA & IBRD countries)SurinameSwazilandSwedenSwitzerlandSyrian Arab RepublicTajikistanTanzaniaThailandTimor-LesteTogoTrinidad and TobagoTunisiaTurkeyUgandaUkraineUnited Arab EmiratesUnited KingdomUnited StatesUpper middle incomeUruguayVanuatuVenezuela, RBWest Bank and GazaWorldYemen, Rep.ZambiaZimbabwe Timeline:
This timeline shows a graph from 1975 to 2015 of Netherlands. No data until 1974. Number of actual observations by date: 41.
Source name:
World Development Indicators
Source organization:
International Monetary Fund, Government Finance Statistics Yearbook and data files.
Categories, topics:
Public Sector
Last updated:
apr 23, 2017
Indicators value changes by year
Maximum:
12.702
jan 1, 1975
At the date of observation
Value
Absolute change
Change from previous value
jan 1, 1975
12.702
+12.702
0.0%
jan 1, 1976
11.982
-0.72
-5.67%
jan 1, 1977
11.766
-0.216
-1.81%
jan 1, 1978
11.438
-0.328
-2.79%
jan 1, 1979
11.328
-0.109
-0.96%
jan 1, 1980
11.193
-0.135
-1.19%
jan 1, 1981
10.824
-0.369
-3.29%
jan 1, 1982
10.28
-0.544
-5.03%
jan 1, 1983
9.804
-0.477
-4.64%
jan 1, 1984
9.414
-0.39
-3.97%
jan 1, 1985
9.111
-0.303
-3.22%
jan 1, 1986
8.993
-0.118
-1.29%
jan 1, 1987
8.843
-0.15
-1.67%
jan 1, 1988
8.758
-0.085
-0.96%
jan 1, 1989
8.962
+0.203
2.32%
jan 1, 1990
9.13
+0.168
1.87%
jan 1, 1991
9.152
+0.022
0.24%
jan 1, 1992
8.485
-0.666
-7.28%
jan 1, 1993
8.54
+0.055
0.65%
jan 1, 1994
8.538
-0.003
-0.03%
jan 1, 1995
9.135
+0.598
7.0%
jan 1, 1996
7.396
-1.74
-19.04%
jan 1, 1997
8.135
+0.74
10.0%
jan 1, 1998
8.035
-0.101
-1.24%
jan 1, 1999
8.183
+0.149
1.85%
jan 1, 2000
8.248
+0.065
0.79%
jan 1, 2001
8.22
-0.028
-0.34%
jan 1, 2002
8.132
-0.088
-1.07%
jan 1, 2003
8.232
+0.1
1.23%
jan 1, 2004
8.111
-0.121
-1.47%
jan 1, 2005
8.073
-0.038
-0.47%
jan 1, 2006
8.069
-0.003
-0.04%
jan 1, 2007
7.354
-0.715
-8.86%
jan 1, 2008
7.296
-0.059
-0.8%
jan 1, 2009
7.182
-0.114
-1.56%
jan 1, 2010
7.126
-0.056
-0.78%
jan 1, 2011
7.121
-0.004
-0.06%
jan 1, 2012
6.97
-0.151
-2.12%
jan 1, 2013
6.964
-0.007
-0.1%
jan 1, 2014
8.149
+1.185
17.02%
jan 1, 2015
8.252
+0.103
1.26%
Ranking of countries by current statistics by years


Comments: