29
/
en
AIzaSyAYiBZKx7MnpbEhh9jyipgxe19OcubqV5w
April 1, 2024
35611
High income
HIC
false
2
1
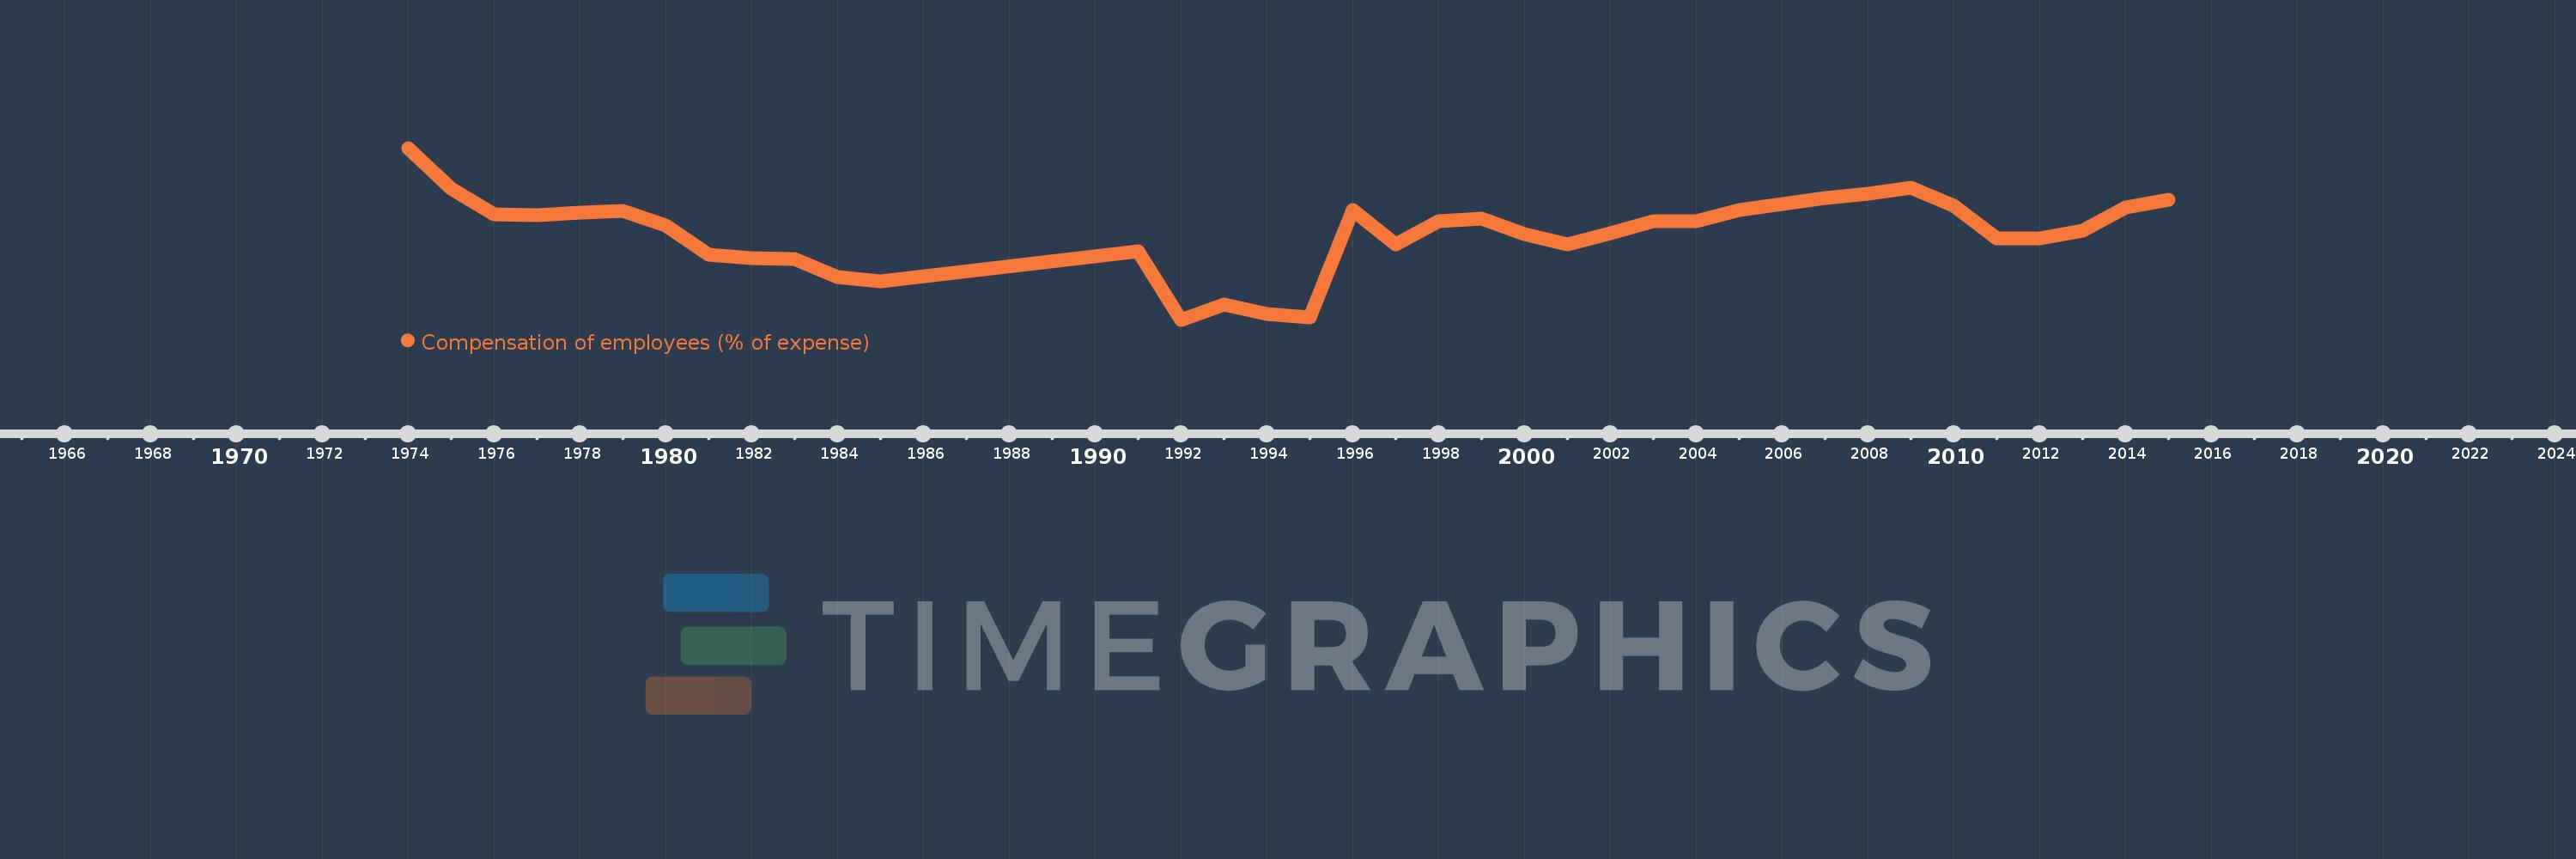
Compensation of employees (% of expense)
2015,2014,2013,2012,2011,2010,2009,2008,2007,2006,2005,2004,2003,2002,2001,2000,1999,1998,1997,1996,1995,1994,1993,1992,1991,1985,1984,1983,1982,1981,1980,1979,1978,1977,1976,1975,1974
This statistics in other country:
AfghanistanAlbaniaAlgeriaAngolaAntigua and BarbudaArab WorldArmeniaAustraliaAustriaAzerbaijanBahamas, TheBahrainBangladeshBarbadosBelarusBelgiumBelizeBeninBhutanBoliviaBosnia and HerzegovinaBotswanaBrazilBulgariaBurkina FasoBurundiCabo VerdeCambodiaCanadaCaribbean small statesCentral African RepublicCentral Europe and the BalticsChileColombiaCongo, Dem. Rep.Congo, Rep.Costa RicaCote d'IvoireCroatiaCyprusCzech RepublicDenmarkDominicaDominican RepublicEarly-demographic dividendEast Asia & PacificEast Asia & Pacific (excluding high income)East Asia & Pacific (IDA & IBRD countries)Egypt, Arab Rep.El SalvadorEquatorial GuineaEstoniaEthiopiaEuro areaEurope & Central AsiaEurope & Central Asia (excluding high income)Europe & Central Asia (IDA & IBRD countries)European UnionFijiFinlandFranceGambia, TheGeorgiaGermanyGhanaGreeceGrenadaGuatemalaHeavily indebted poor countries (HIPC)High incomeHondurasHong Kong SAR, ChinaHungaryIBRD onlyIcelandIDA & IBRD totalIDA blendIDA onlyIDA totalIndiaIndonesiaIran, Islamic Rep.IraqIrelandIsraelItalyJamaicaJapanJordanKazakhstanKenyaKiribatiKorea, Rep.KuwaitKyrgyz RepublicLao PDRLate-demographic dividendLatin America & Caribbean Latin America & Caribbean (excluding high income)Latin America & the Caribbean (IDA & IBRD countries)LatviaLeast developed countries: UN classificationLebanonLesothoLiberiaLithuaniaLow & middle incomeLow incomeLower middle incomeLuxembourgMacao SAR, ChinaMacedonia, FYRMadagascarMalawiMalaysiaMaldivesMaliMaltaMauritiusMexicoMicronesia, Fed. Sts.Middle East & North AfricaMiddle East & North Africa (excluding high income)Middle East & North Africa (IDA & IBRD countries)Middle incomeMoldovaMongoliaMoroccoMozambiqueNamibiaNepalNetherlandsNew ZealandNicaraguaNigeriaNorth AmericaNorwayOECD membersOmanOther small statesPakistanPanamaPapua New GuineaParaguayPeruPhilippinesPolandPortugalPost-demographic dividendPre-demographic dividendQatarRomaniaRussian FederationRwandaSamoaSan MarinoSao Tome and PrincipeSenegalSerbiaSeychellesSierra LeoneSingaporeSlovak RepublicSloveniaSmall statesSolomon IslandsSouth AfricaSouth AsiaSouth Asia (IDA & IBRD)SpainSri LankaSt. Kitts and NevisSt. LuciaSub-Saharan Africa Sub-Saharan Africa (excluding high income)Sub-Saharan Africa (IDA & IBRD countries)SurinameSwazilandSwedenSwitzerlandSyrian Arab RepublicTajikistanTanzaniaThailandTimor-LesteTogoTrinidad and TobagoTunisiaTurkeyUgandaUkraineUnited Arab EmiratesUnited KingdomUnited StatesUpper middle incomeUruguayVanuatuVenezuela, RBWest Bank and GazaWorldYemen, Rep.ZambiaZimbabwe Timeline:
This timeline shows a graph from 1974 to 2015 of High income. No data until 1973. Number of actual observations by date: 37.
Source name:
World Development Indicators
Source organization:
International Monetary Fund, Government Finance Statistics Yearbook and data files.
Categories, topics:
Public Sector
Last updated:
apr 23, 2017
Indicators value changes by year
Minimum:
11.234
jan 1, 1992
Maximum:
18.367
jan 1, 1974
At the date of observation
Value
Absolute change
Change from previous value
jan 1, 1974
18.367
+18.367
0.0%
jan 1, 1975
16.697
-1.67
-9.09%
jan 1, 1976
15.606
-1.091
-6.54%
jan 1, 1977
15.586
-0.021
-0.13%
jan 1, 1978
15.693
+0.107
0.69%
jan 1, 1979
15.74
+0.047
0.3%
jan 1, 1980
15.146
-0.594
-3.77%
jan 1, 1981
13.935
-1.211
-7.99%
jan 1, 1982
13.788
-0.147
-1.06%
jan 1, 1983
13.761
-0.027
-0.19%
jan 1, 1984
13.024
-0.737
-5.36%
jan 1, 1985
12.829
-0.196
-1.5%
jan 1, 1991
14.069
+1.24
9.67%
jan 1, 1992
11.234
-2.835
-20.15%
jan 1, 1993
11.866
+0.632
5.63%
jan 1, 1994
11.485
-0.381
-3.21%
jan 1, 1995
11.323
-0.162
-1.41%
jan 1, 1996
15.782
+4.46
39.39%
jan 1, 1997
14.375
-1.408
-8.92%
jan 1, 1998
15.332
+0.957
6.66%
jan 1, 1999
15.424
+0.092
0.6%
jan 1, 2000
14.786
-0.638
-4.14%
jan 1, 2001
14.367
-0.419
-2.83%
jan 1, 2002
14.838
+0.471
3.28%
jan 1, 2003
15.331
+0.493
3.32%
jan 1, 2004
15.327
-0.004
-0.03%
jan 1, 2005
15.793
+0.466
3.04%
jan 1, 2006
16.029
+0.236
1.49%
jan 1, 2007
16.273
+0.245
1.53%
jan 1, 2008
16.466
+0.193
1.18%
jan 1, 2009
16.712
+0.246
1.49%
jan 1, 2010
15.98
-0.731
-4.38%
jan 1, 2011
14.625
-1.355
-8.48%
jan 1, 2012
14.628
+0.002
0.02%
jan 1, 2013
14.93
+0.303
2.07%
jan 1, 2014
15.893
+0.962
6.44%
jan 1, 2015
16.233
+0.341
2.14%
Ranking of countries by current statistics by years


Comments: