29
/
en
AIzaSyAYiBZKx7MnpbEhh9jyipgxe19OcubqV5w
April 1, 2024
153377
Iceland
ISL
true
2
1
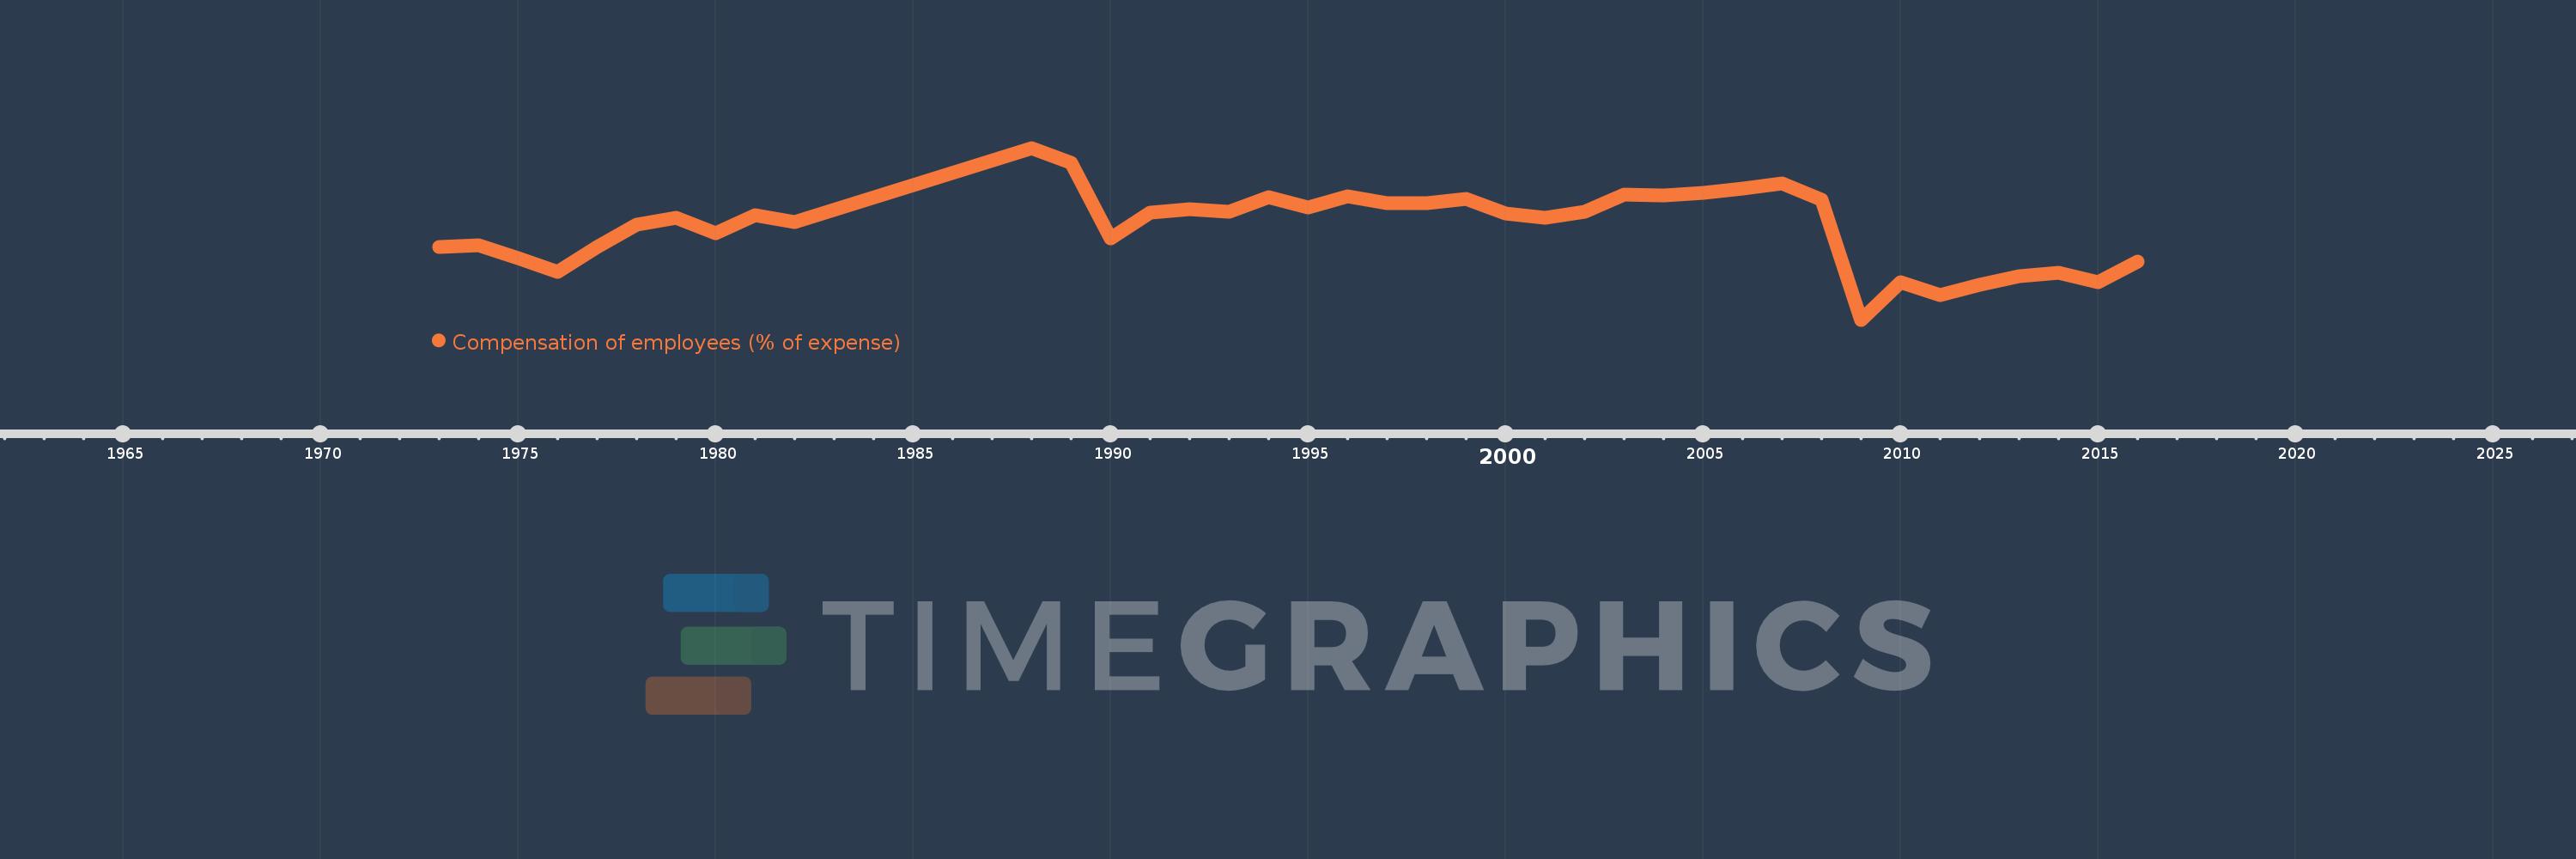
Compensation of employees (% of expense)
2016,2015,2014,2013,2012,2011,2010,2009,2008,2007,2006,2005,2004,2003,2002,2001,2000,1999,1998,1997,1996,1995,1994,1993,1992,1991,1990,1989,1988,1982,1981,1980,1979,1978,1977,1976,1975,1974,1973
This statistics in other country:
AfghanistanAlbaniaAlgeriaAngolaAntigua and BarbudaArab WorldArmeniaAustraliaAustriaAzerbaijanBahamas, TheBahrainBangladeshBarbadosBelarusBelgiumBelizeBeninBhutanBoliviaBosnia and HerzegovinaBotswanaBrazilBulgariaBurkina FasoBurundiCabo VerdeCambodiaCanadaCaribbean small statesCentral African RepublicCentral Europe and the BalticsChileColombiaCongo, Dem. Rep.Congo, Rep.Costa RicaCote d'IvoireCroatiaCyprusCzech RepublicDenmarkDominicaDominican RepublicEarly-demographic dividendEast Asia & PacificEast Asia & Pacific (excluding high income)East Asia & Pacific (IDA & IBRD countries)Egypt, Arab Rep.El SalvadorEquatorial GuineaEstoniaEthiopiaEuro areaEurope & Central AsiaEurope & Central Asia (excluding high income)Europe & Central Asia (IDA & IBRD countries)European UnionFijiFinlandFranceGambia, TheGeorgiaGermanyGhanaGreeceGrenadaGuatemalaHeavily indebted poor countries (HIPC)High incomeHondurasHong Kong SAR, ChinaHungaryIBRD onlyIcelandIDA & IBRD totalIDA blendIDA onlyIDA totalIndiaIndonesiaIran, Islamic Rep.IraqIrelandIsraelItalyJamaicaJapanJordanKazakhstanKenyaKiribatiKorea, Rep.KuwaitKyrgyz RepublicLao PDRLate-demographic dividendLatin America & Caribbean Latin America & Caribbean (excluding high income)Latin America & the Caribbean (IDA & IBRD countries)LatviaLeast developed countries: UN classificationLebanonLesothoLiberiaLithuaniaLow & middle incomeLow incomeLower middle incomeLuxembourgMacao SAR, ChinaMacedonia, FYRMadagascarMalawiMalaysiaMaldivesMaliMaltaMauritiusMexicoMicronesia, Fed. Sts.Middle East & North AfricaMiddle East & North Africa (excluding high income)Middle East & North Africa (IDA & IBRD countries)Middle incomeMoldovaMongoliaMoroccoMozambiqueNamibiaNepalNetherlandsNew ZealandNicaraguaNigeriaNorth AmericaNorwayOECD membersOmanOther small statesPakistanPanamaPapua New GuineaParaguayPeruPhilippinesPolandPortugalPost-demographic dividendPre-demographic dividendQatarRomaniaRussian FederationRwandaSamoaSan MarinoSao Tome and PrincipeSenegalSerbiaSeychellesSierra LeoneSingaporeSlovak RepublicSloveniaSmall statesSolomon IslandsSouth AfricaSouth AsiaSouth Asia (IDA & IBRD)SpainSri LankaSt. Kitts and NevisSt. LuciaSub-Saharan Africa Sub-Saharan Africa (excluding high income)Sub-Saharan Africa (IDA & IBRD countries)SurinameSwazilandSwedenSwitzerlandSyrian Arab RepublicTajikistanTanzaniaThailandTimor-LesteTogoTrinidad and TobagoTunisiaTurkeyUgandaUkraineUnited Arab EmiratesUnited KingdomUnited StatesUpper middle incomeUruguayVanuatuVenezuela, RBWest Bank and GazaWorldYemen, Rep.ZambiaZimbabwe Timeline:
This timeline shows a graph from 1973 to 2016 of Iceland. No data until 1972. Number of actual observations by date: 39.
Source name:
World Development Indicators
Source organization:
International Monetary Fund, Government Finance Statistics Yearbook and data files.
Categories, topics:
Public Sector
Last updated:
apr 23, 2017
Indicators value changes by year
Minimum:
20.279
jan 1, 2009
Maximum:
35.323
jan 1, 1988
At the date of observation
Value
Absolute change
Change from previous value
jan 1, 1973
26.667
+26.667
0.0%
jan 1, 1974
26.805
+0.138
0.52%
jan 1, 1975
25.658
-1.146
-4.28%
jan 1, 1976
24.457
-1.202
-4.68%
jan 1, 1977
26.669
+2.212
9.04%
jan 1, 1978
28.612
+1.943
7.29%
jan 1, 1979
29.236
+0.624
2.18%
jan 1, 1980
27.818
-1.418
-4.85%
jan 1, 1981
29.426
+1.608
5.78%
jan 1, 1982
28.831
-0.595
-2.02%
jan 1, 1988
35.323
+6.492
22.52%
jan 1, 1989
34.026
-1.296
-3.67%
jan 1, 1990
27.437
-6.589
-19.37%
jan 1, 1991
29.641
+2.204
8.03%
jan 1, 1992
29.969
+0.329
1.11%
jan 1, 1993
29.747
-0.222
-0.74%
jan 1, 1994
30.992
+1.245
4.18%
jan 1, 1995
30.086
-0.906
-2.92%
jan 1, 1996
31.1
+1.013
3.37%
jan 1, 1997
30.495
-0.604
-1.94%
jan 1, 1998
30.461
-0.034
-0.11%
jan 1, 1999
30.878
+0.417
1.37%
jan 1, 2000
29.58
-1.298
-4.21%
jan 1, 2001
29.205
-0.375
-1.27%
jan 1, 2002
29.763
+0.558
1.91%
jan 1, 2003
31.271
+1.508
5.07%
jan 1, 2004
31.153
-0.118
-0.38%
jan 1, 2005
31.357
+0.204
0.65%
jan 1, 2006
31.799
+0.442
1.41%
jan 1, 2007
32.215
+0.416
1.31%
jan 1, 2008
30.778
-1.437
-4.46%
jan 1, 2009
20.279
-10.499
-34.11%
jan 1, 2010
23.585
+3.306
16.3%
jan 1, 2011
22.411
-1.174
-4.98%
jan 1, 2012
23.357
+0.946
4.22%
jan 1, 2013
24.078
+0.721
3.09%
jan 1, 2014
24.371
+0.293
1.22%
jan 1, 2015
23.553
-0.818
-3.36%
jan 1, 2016
25.378
+1.825
7.75%
Ranking of countries by current statistics by years


Comments: