29
/
en
AIzaSyAYiBZKx7MnpbEhh9jyipgxe19OcubqV5w
April 1, 2024
33303
European Union
EUU
false
2
1
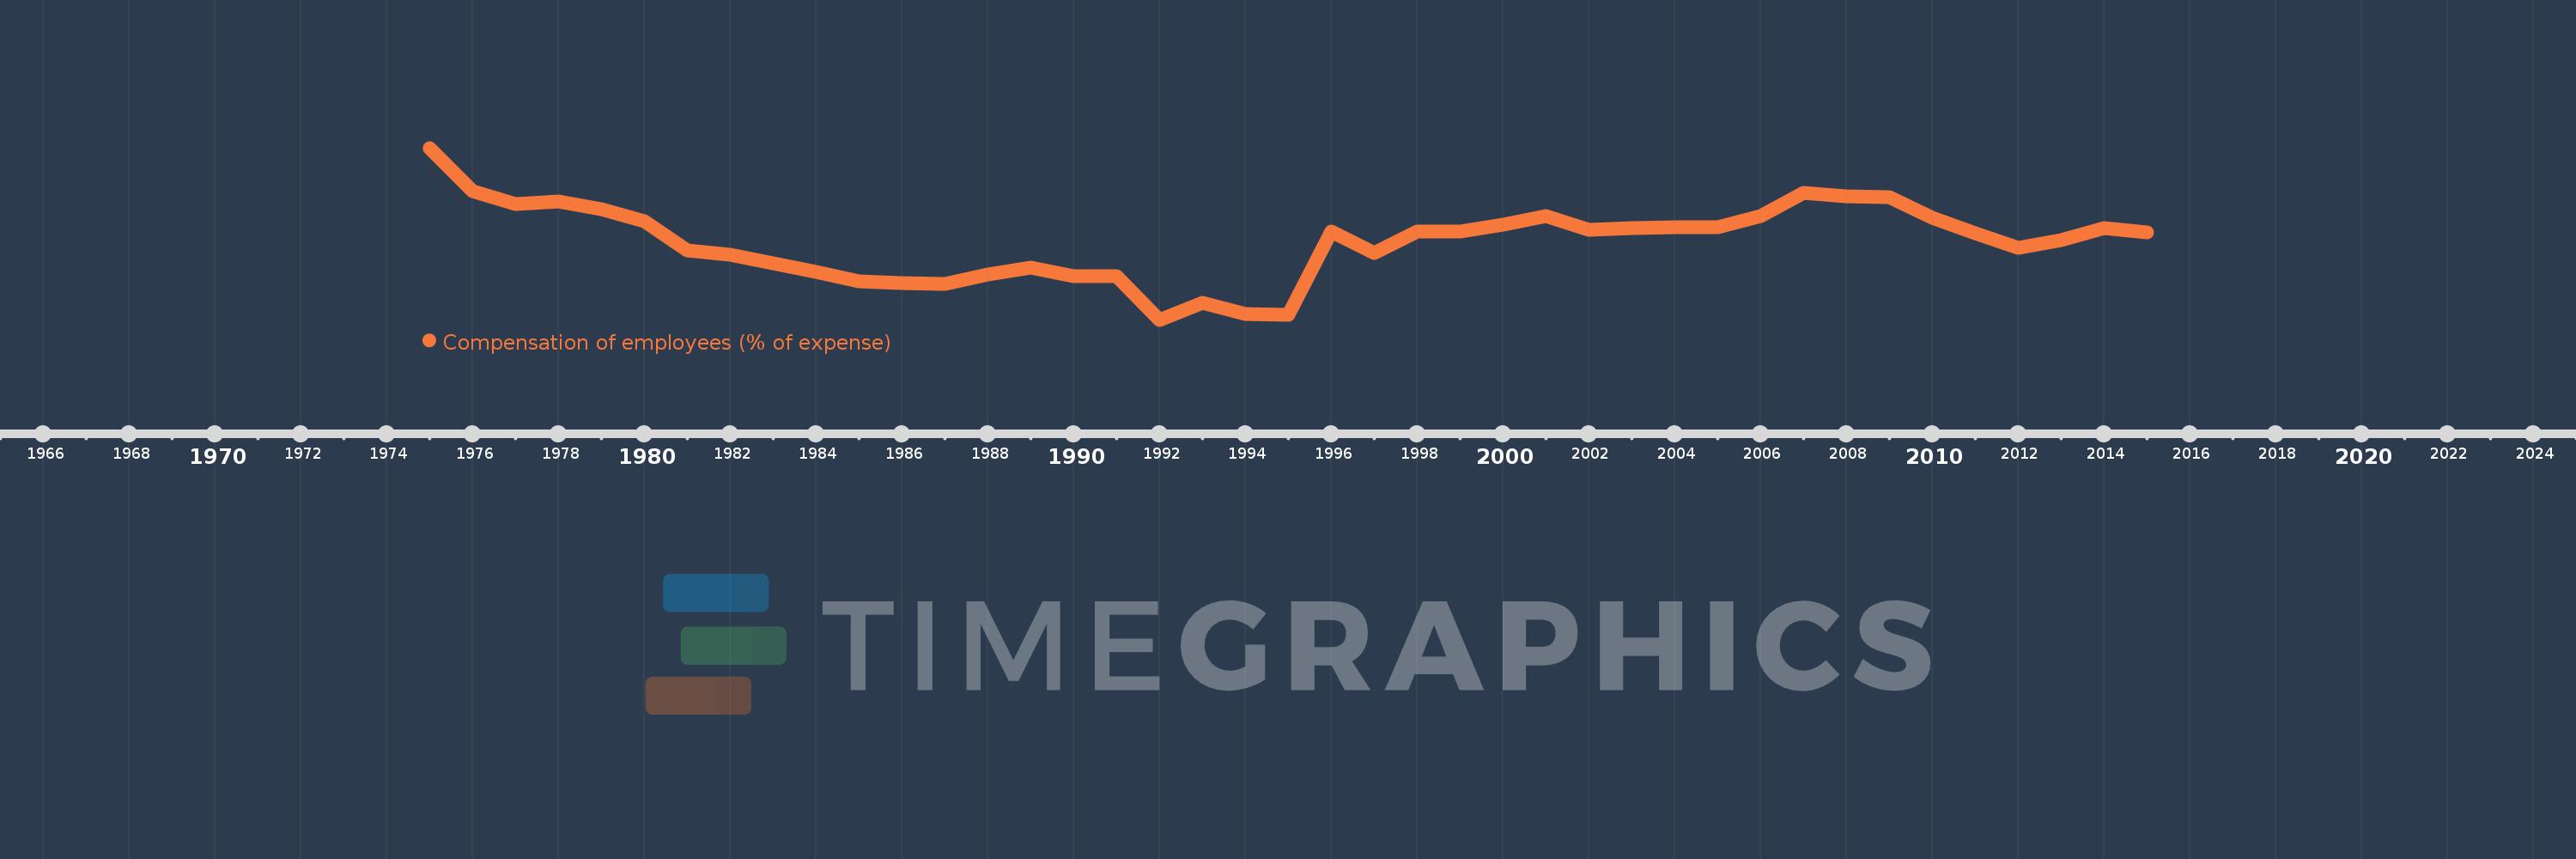
Compensation of employees (% of expense)
2015,2014,2013,2012,2011,2010,2009,2008,2007,2006,2005,2004,2003,2002,2001,2000,1999,1998,1997,1996,1995,1994,1993,1992,1991,1990,1989,1988,1987,1986,1985,1984,1983,1982,1981,1980,1979,1978,1977,1976,1975
This statistics in other country:
AfghanistanAlbaniaAlgeriaAngolaAntigua and BarbudaArab WorldArmeniaAustraliaAustriaAzerbaijanBahamas, TheBahrainBangladeshBarbadosBelarusBelgiumBelizeBeninBhutanBoliviaBosnia and HerzegovinaBotswanaBrazilBulgariaBurkina FasoBurundiCabo VerdeCambodiaCanadaCaribbean small statesCentral African RepublicCentral Europe and the BalticsChileColombiaCongo, Dem. Rep.Congo, Rep.Costa RicaCote d'IvoireCroatiaCyprusCzech RepublicDenmarkDominicaDominican RepublicEarly-demographic dividendEast Asia & PacificEast Asia & Pacific (excluding high income)East Asia & Pacific (IDA & IBRD countries)Egypt, Arab Rep.El SalvadorEquatorial GuineaEstoniaEthiopiaEuro areaEurope & Central AsiaEurope & Central Asia (excluding high income)Europe & Central Asia (IDA & IBRD countries)European UnionFijiFinlandFranceGambia, TheGeorgiaGermanyGhanaGreeceGrenadaGuatemalaHeavily indebted poor countries (HIPC)High incomeHondurasHong Kong SAR, ChinaHungaryIBRD onlyIcelandIDA & IBRD totalIDA blendIDA onlyIDA totalIndiaIndonesiaIran, Islamic Rep.IraqIrelandIsraelItalyJamaicaJapanJordanKazakhstanKenyaKiribatiKorea, Rep.KuwaitKyrgyz RepublicLao PDRLate-demographic dividendLatin America & Caribbean Latin America & Caribbean (excluding high income)Latin America & the Caribbean (IDA & IBRD countries)LatviaLeast developed countries: UN classificationLebanonLesothoLiberiaLithuaniaLow & middle incomeLow incomeLower middle incomeLuxembourgMacao SAR, ChinaMacedonia, FYRMadagascarMalawiMalaysiaMaldivesMaliMaltaMauritiusMexicoMicronesia, Fed. Sts.Middle East & North AfricaMiddle East & North Africa (excluding high income)Middle East & North Africa (IDA & IBRD countries)Middle incomeMoldovaMongoliaMoroccoMozambiqueNamibiaNepalNetherlandsNew ZealandNicaraguaNigeriaNorth AmericaNorwayOECD membersOmanOther small statesPakistanPanamaPapua New GuineaParaguayPeruPhilippinesPolandPortugalPost-demographic dividendPre-demographic dividendQatarRomaniaRussian FederationRwandaSamoaSan MarinoSao Tome and PrincipeSenegalSerbiaSeychellesSierra LeoneSingaporeSlovak RepublicSloveniaSmall statesSolomon IslandsSouth AfricaSouth AsiaSouth Asia (IDA & IBRD)SpainSri LankaSt. Kitts and NevisSt. LuciaSub-Saharan Africa Sub-Saharan Africa (excluding high income)Sub-Saharan Africa (IDA & IBRD countries)SurinameSwazilandSwedenSwitzerlandSyrian Arab RepublicTajikistanTanzaniaThailandTimor-LesteTogoTrinidad and TobagoTunisiaTurkeyUgandaUkraineUnited Arab EmiratesUnited KingdomUnited StatesUpper middle incomeUruguayVanuatuVenezuela, RBWest Bank and GazaWorldYemen, Rep.ZambiaZimbabwe Timeline:
This timeline shows a graph from 1975 to 2015 of European Union. No data until 1974. Number of actual observations by date: 41.
Source name:
World Development Indicators
Source organization:
International Monetary Fund, Government Finance Statistics Yearbook and data files.
Categories, topics:
Public Sector
Last updated:
apr 23, 2017
Indicators value changes by year
Minimum:
11.107
jan 1, 1992
Maximum:
17.771
jan 1, 1975
At the date of observation
Value
Absolute change
Change from previous value
jan 1, 1975
17.771
+17.771
0.0%
jan 1, 1976
16.086
-1.685
-9.48%
jan 1, 1977
15.586
-0.5
-3.11%
jan 1, 1978
15.693
+0.107
0.69%
jan 1, 1979
15.389
-0.303
-1.93%
jan 1, 1980
14.917
-0.472
-3.07%
jan 1, 1981
13.784
-1.133
-7.59%
jan 1, 1982
13.618
-0.166
-1.21%
jan 1, 1983
13.308
-0.31
-2.28%
jan 1, 1984
12.948
-0.36
-2.7%
jan 1, 1985
12.606
-0.341
-2.64%
jan 1, 1986
12.517
-0.089
-0.71%
jan 1, 1987
12.51
-0.008
-0.06%
jan 1, 1988
12.875
+0.365
2.92%
jan 1, 1989
13.117
+0.243
1.88%
jan 1, 1990
12.784
-0.333
-2.54%
jan 1, 1991
12.798
+0.013
0.1%
jan 1, 1992
11.107
-1.69
-13.21%
jan 1, 1993
11.779
+0.672
6.05%
jan 1, 1994
11.338
-0.442
-3.75%
jan 1, 1995
11.281
-0.056
-0.5%
jan 1, 1996
14.523
+3.242
28.74%
jan 1, 1997
13.698
-0.825
-5.68%
jan 1, 1998
14.518
+0.82
5.99%
jan 1, 1999
14.543
+0.025
0.17%
jan 1, 2000
14.786
+0.243
1.67%
jan 1, 2001
15.145
+0.359
2.43%
jan 1, 2002
14.597
-0.548
-3.62%
jan 1, 2003
14.66
+0.063
0.43%
jan 1, 2004
14.686
+0.025
0.17%
jan 1, 2005
14.683
-0.003
-0.02%
jan 1, 2006
15.123
+0.44
3.0%
jan 1, 2007
16.03
+0.907
6.0%
jan 1, 2008
15.897
-0.134
-0.83%
jan 1, 2009
15.865
-0.032
-0.2%
jan 1, 2010
15.055
-0.81
-5.1%
jan 1, 2011
14.451
-0.604
-4.01%
jan 1, 2012
13.909
-0.543
-3.75%
jan 1, 2013
14.192
+0.284
2.04%
jan 1, 2014
14.674
+0.482
3.4%
jan 1, 2015
14.486
-0.189
-1.29%
Ranking of countries by current statistics by years


Comments: