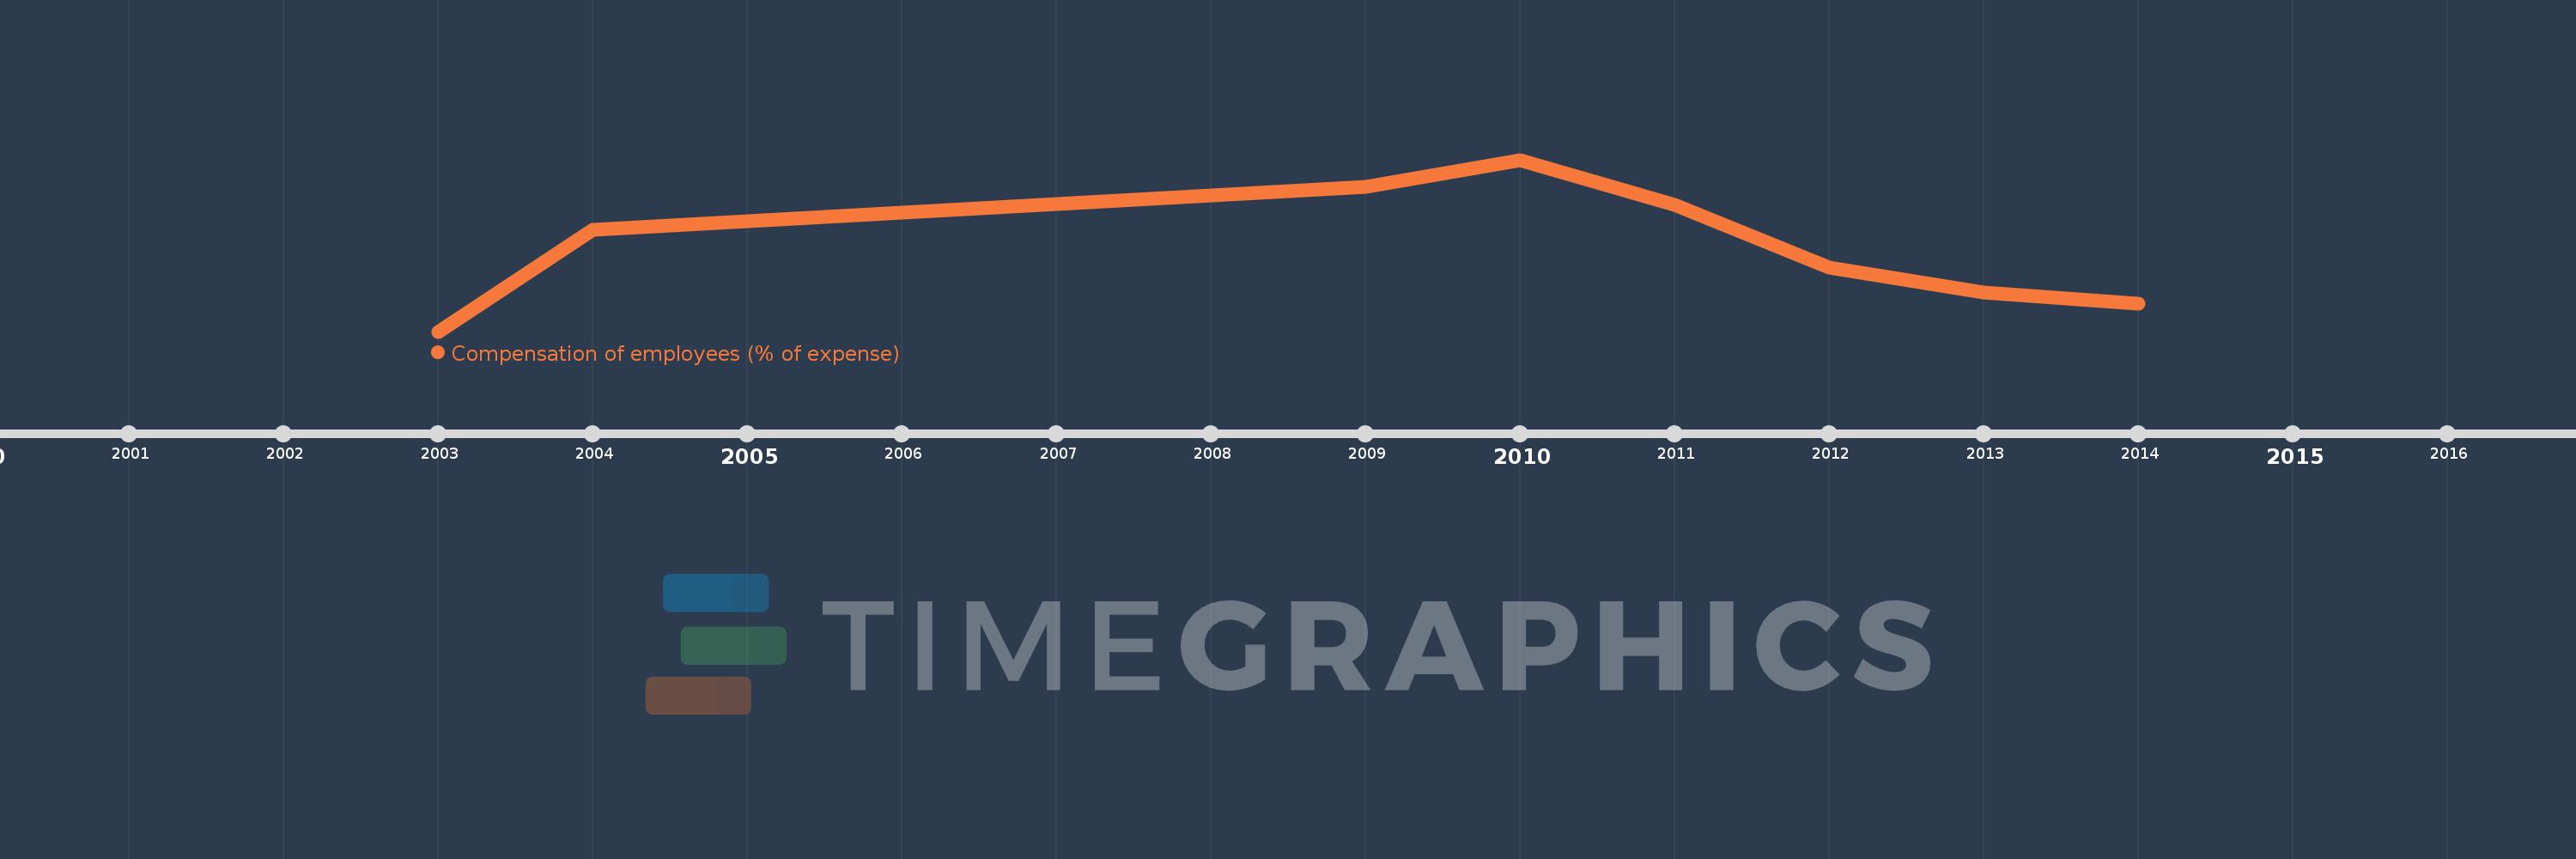
This timeline shows a graph from 2003 to 2014 of East Asia & Pacific (excluding high income). No data until 2002. Number of actual observations by date: 8.
Source name:
World Development Indicators
Source organization:
International Monetary Fund, Government Finance Statistics Yearbook and data files.
Categories, topics:
Public Sector
Last updated:
apr 23, 2017
Indicators value changes by year
Meaning:
31.566
Minimum:
27.779
jan 1, 2003
Maximum:
35.487
jan 1, 2010
At the date of observation
Value
Absolute change
Change from the previous value
jan 1, 2003
27.779
+27.779
0.0%
jan 1, 2004
32.359
+4.58
16.49%
jan 1, 2009
34.267
+1.909
5.9%
jan 1, 2010
35.487
+1.219
3.56%
jan 1, 2011
33.453
-2.034
-5.73%
jan 1, 2012
30.637
-2.815
-8.42%
jan 1, 2013
29.523
-1.114
-3.64%
jan 1, 2014
29.023
-0.501
-1.7%
Ranking of countries by current statistics by years
