29
/pt/
pt
AIzaSyAYiBZKx7MnpbEhh9jyipgxe19OcubqV5w
April 1, 2024
160307
Israel
ISR
true
2
1
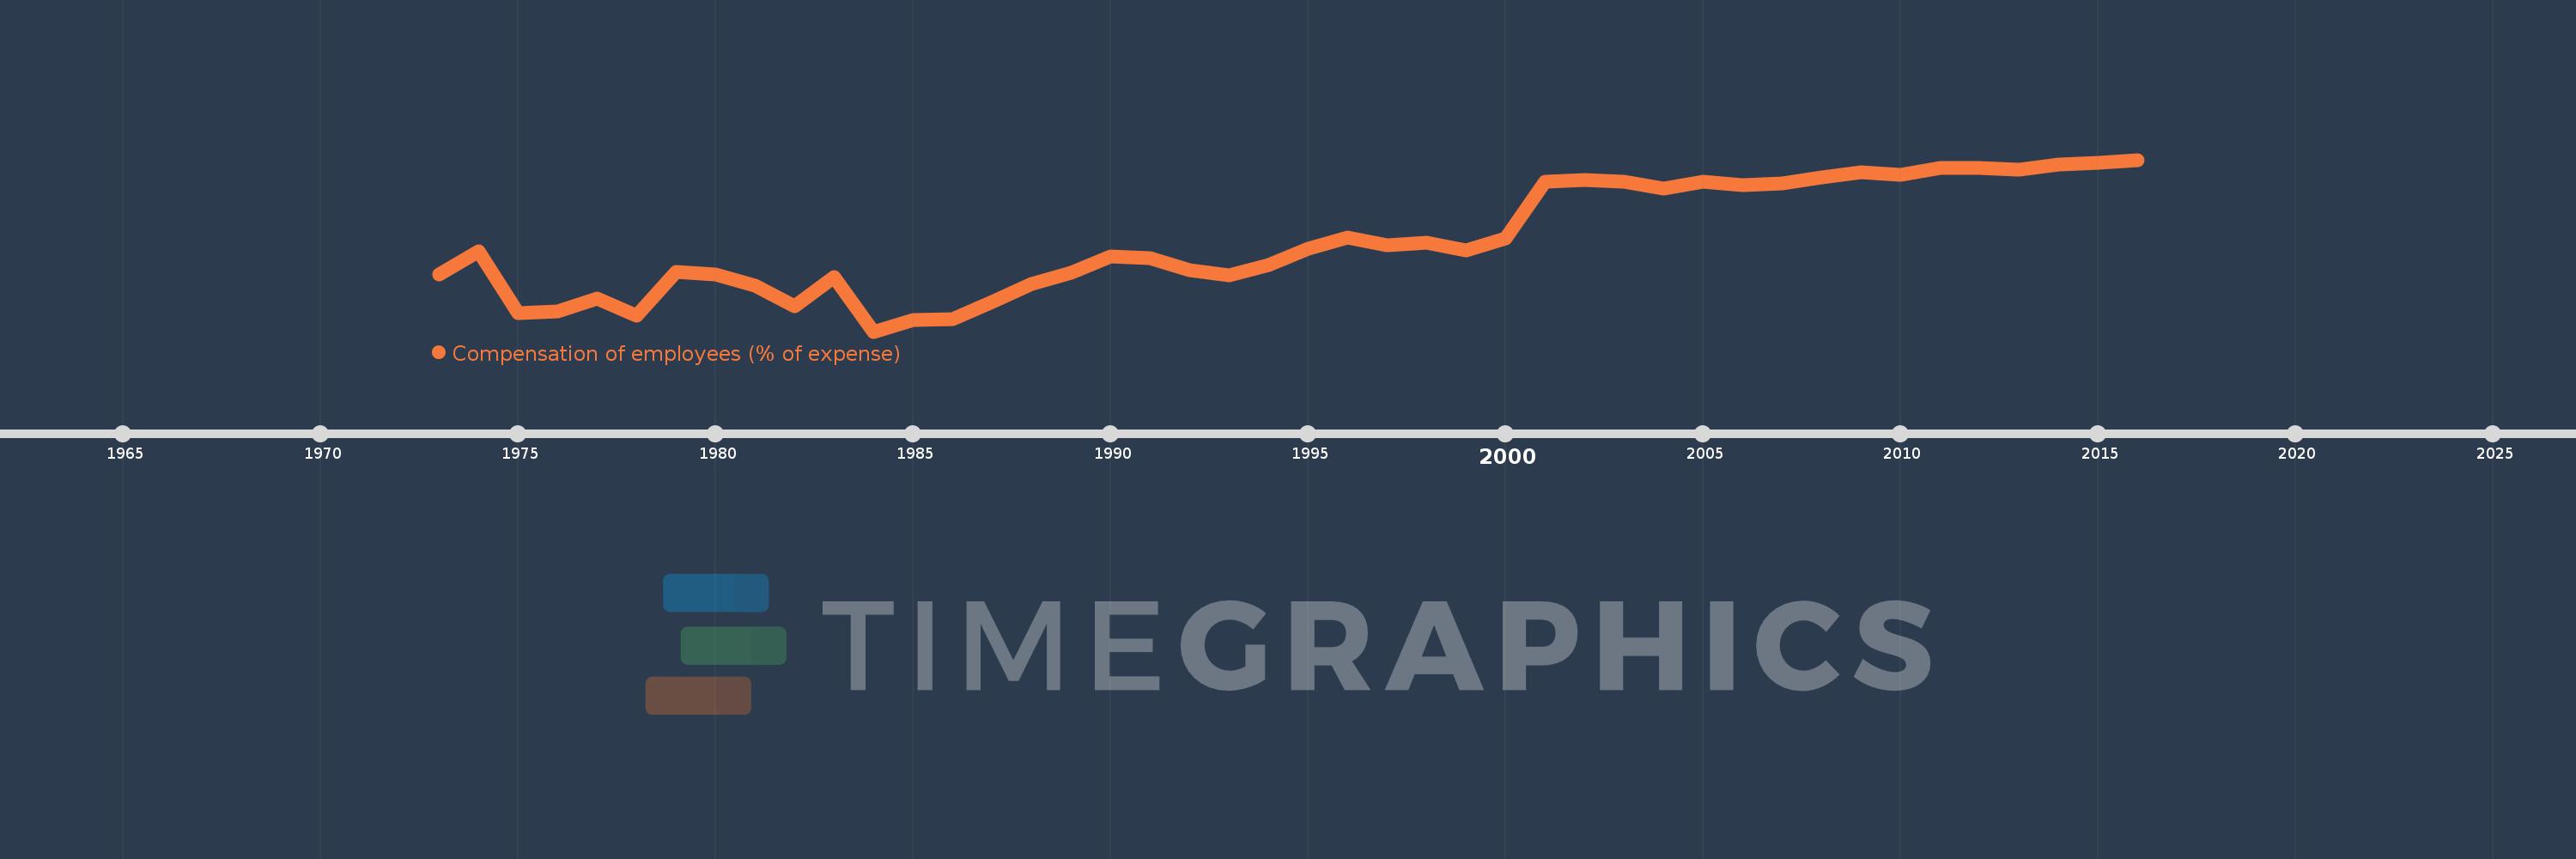
Compensation of employees (% of expense)
2016,2015,2014,2013,2012,2011,2010,2009,2008,2007,2006,2005,2004,2003,2002,2001,2000,1999,1998,1997,1996,1995,1994,1993,1992,1991,1990,1989,1988,1987,1986,1985,1984,1983,1982,1981,1980,1979,1978,1977,1976,1975,1974,1973
Estas estatísticas em outros países:
AfghanistanAlbaniaAlgeriaAngolaAntigua and BarbudaArab WorldArmeniaAustraliaAustriaAzerbaijanBahamas, TheBahrainBangladeshBarbadosBelarusBelgiumBelizeBeninBhutanBoliviaBosnia and HerzegovinaBotswanaBrazilBulgariaBurkina FasoBurundiCabo VerdeCambodiaCanadaCaribbean small statesCentral African RepublicCentral Europe and the BalticsChileColombiaCongo, Dem. Rep.Congo, Rep.Costa RicaCote d'IvoireCroatiaCyprusCzech RepublicDenmarkDominicaDominican RepublicEarly-demographic dividendEast Asia & PacificEast Asia & Pacific (excluding high income)East Asia & Pacific (IDA & IBRD countries)Egypt, Arab Rep.El SalvadorEquatorial GuineaEstoniaEthiopiaEuro areaEurope & Central AsiaEurope & Central Asia (excluding high income)Europe & Central Asia (IDA & IBRD countries)European UnionFijiFinlandFranceGambia, TheGeorgiaGermanyGhanaGreeceGrenadaGuatemalaHeavily indebted poor countries (HIPC)High incomeHondurasHong Kong SAR, ChinaHungaryIBRD onlyIcelandIDA & IBRD totalIDA blendIDA onlyIDA totalIndiaIndonesiaIran, Islamic Rep.IraqIrelandIsraelItalyJamaicaJapanJordanKazakhstanKenyaKiribatiKorea, Rep.KuwaitKyrgyz RepublicLao PDRLate-demographic dividendLatin America & Caribbean Latin America & Caribbean (excluding high income)Latin America & the Caribbean (IDA & IBRD countries)LatviaLeast developed countries: UN classificationLebanonLesothoLiberiaLithuaniaLow & middle incomeLow incomeLower middle incomeLuxembourgMacao SAR, ChinaMacedonia, FYRMadagascarMalawiMalaysiaMaldivesMaliMaltaMauritiusMexicoMicronesia, Fed. Sts.Middle East & North AfricaMiddle East & North Africa (excluding high income)Middle East & North Africa (IDA & IBRD countries)Middle incomeMoldovaMongoliaMoroccoMozambiqueNamibiaNepalNetherlandsNew ZealandNicaraguaNigeriaNorth AmericaNorwayOECD membersOmanOther small statesPakistanPanamaPapua New GuineaParaguayPeruPhilippinesPolandPortugalPost-demographic dividendPre-demographic dividendQatarRomaniaRussian FederationRwandaSamoaSan MarinoSao Tome and PrincipeSenegalSerbiaSeychellesSierra LeoneSingaporeSlovak RepublicSloveniaSmall statesSolomon IslandsSouth AfricaSouth AsiaSouth Asia (IDA & IBRD)SpainSri LankaSt. Kitts and NevisSt. LuciaSub-Saharan Africa Sub-Saharan Africa (excluding high income)Sub-Saharan Africa (IDA & IBRD countries)SurinameSwazilandSwedenSwitzerlandSyrian Arab RepublicTajikistanTanzaniaThailandTimor-LesteTogoTrinidad and TobagoTunisiaTurkeyUgandaUkraineUnited Arab EmiratesUnited KingdomUnited StatesUpper middle incomeUruguayVanuatuVenezuela, RBWest Bank and GazaWorldYemen, Rep.ZambiaZimbabwe Linha do tempo:
Nesta escala de tempo está apresentado um gráfico de 1973 ano até 2016 ano Israel. Dados de 1972 ano ausente. O número de observações reais por data: 44.
Fonte (nome):
Indicadores de desenvolvimento mundial
Fonte (organização):
International Monetary Fund, Government Finance Statistics Yearbook and data files.
Categorias:
Public Sector
Foi atualizado:
23 abr 2017 ano
Indicadores de alterações dos valores ao longo dos anos
Mínimo:
10.047
1 jan 1984 ano
Máximo:
22.722
1 jan 2016 ano
Na data de observação
Valor
Mudança absoluta
A alteração em relação ao valor anterior
1 jan 1973 ano
14.286
+14.286
0.0%
1 jan 1974 ano
16.0
+1.714
12.0%
1 jan 1975 ano
11.429
-4.571
-28.57%
1 jan 1976 ano
11.538
+0.11
0.96%
1 jan 1977 ano
12.5
+0.962
8.33%
1 jan 1978 ano
11.215
-1.285
-10.28%
1 jan 1979 ano
14.465
+3.25
28.98%
1 jan 1980 ano
14.286
-0.18
-1.24%
1 jan 1981 ano
13.433
-0.853
-5.97%
1 jan 1982 ano
11.917
-1.516
-11.29%
1 jan 1983 ano
14.08
+2.163
18.15%
1 jan 1984 ano
10.047
-4.033
-28.65%
1 jan 1985 ano
10.904
+0.857
8.53%
1 jan 1986 ano
10.996
+0.092
0.84%
1 jan 1987 ano
12.236
+1.239
11.27%
1 jan 1988 ano
13.587
+1.352
11.05%
1 jan 1989 ano
14.418
+0.831
6.11%
1 jan 1990 ano
15.591
+1.173
8.14%
1 jan 1991 ano
15.478
-0.113
-0.73%
1 jan 1992 ano
14.607
-0.871
-5.63%
1 jan 1993 ano
14.211
-0.396
-2.71%
1 jan 1994 ano
14.976
+0.765
5.38%
1 jan 1995 ano
16.162
+1.186
7.92%
1 jan 1996 ano
17.018
+0.856
5.29%
1 jan 1997 ano
16.397
-0.621
-3.65%
1 jan 1998 ano
16.576
+0.179
1.09%
1 jan 1999 ano
16.054
-0.522
-3.15%
1 jan 2000 ano
16.943
+0.89
5.54%
1 jan 2001 ano
21.108
+4.165
24.58%
1 jan 2002 ano
21.248
+0.139
0.66%
1 jan 2003 ano
21.088
-0.16
-0.75%
1 jan 2004 ano
20.621
-0.467
-2.21%
1 jan 2005 ano
21.101
+0.48
2.33%
1 jan 2006 ano
20.83
-0.271
-1.28%
1 jan 2007 ano
20.963
+0.132
0.64%
1 jan 2008 ano
21.398
+0.435
2.08%
1 jan 2009 ano
21.817
+0.419
1.96%
1 jan 2010 ano
21.624
-0.193
-0.89%
1 jan 2011 ano
22.093
+0.469
2.17%
1 jan 2012 ano
22.14
+0.047
0.21%
1 jan 2013 ano
22.015
-0.125
-0.56%
1 jan 2014 ano
22.369
+0.354
1.61%
1 jan 2015 ano
22.507
+0.138
0.62%
1 jan 2016 ano
22.722
+0.214
0.95%
Classificação de países por estatísticas atuais por anos


Comentários: