29
/pt/
pt
AIzaSyAYiBZKx7MnpbEhh9jyipgxe19OcubqV5w
April 1, 2024
90626
Botswana
BWA
true
2
1
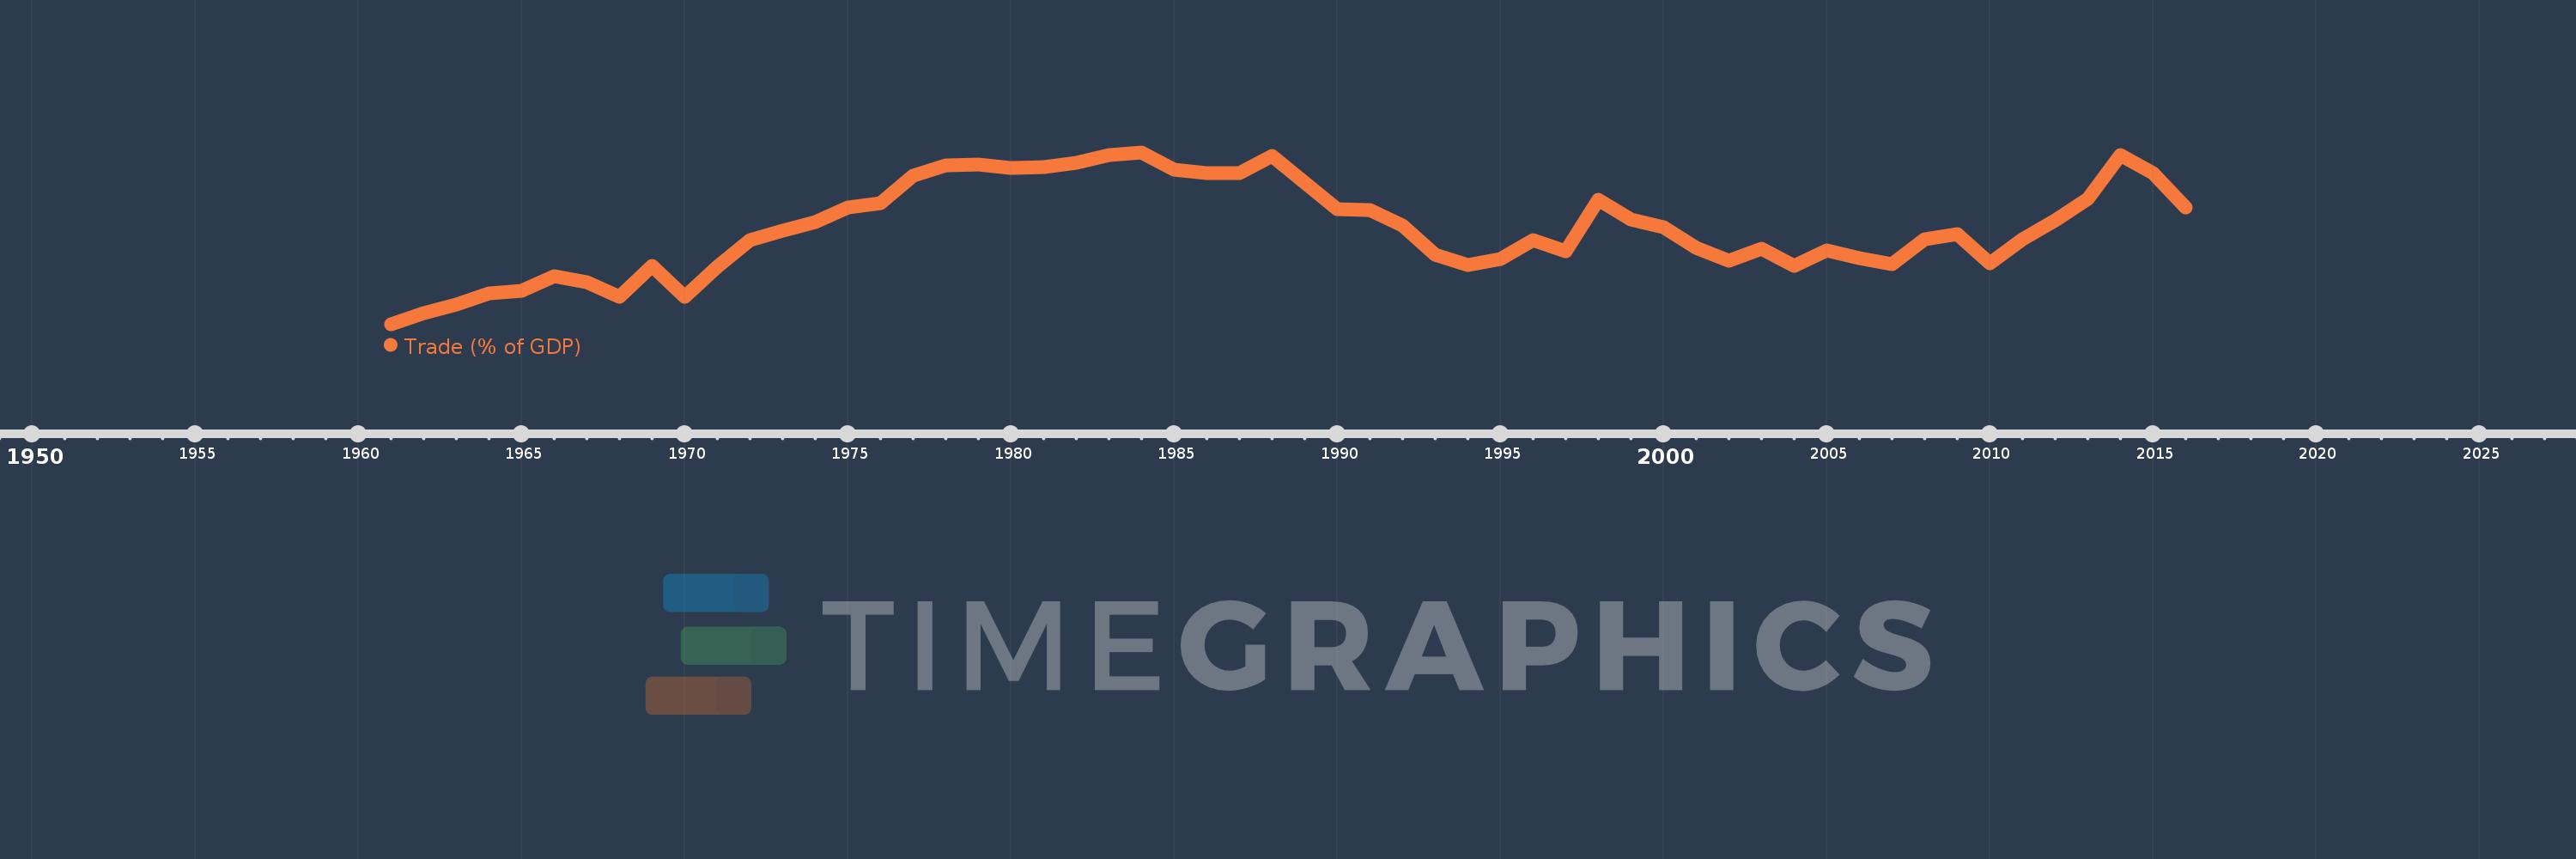
Trade (% of GDP)
2016,2015,2014,2013,2012,2011,2010,2009,2008,2007,2006,2005,2004,2003,2002,2001,2000,1999,1998,1997,1996,1995,1994,1993,1992,1991,1990,1989,1988,1987,1986,1985,1984,1983,1982,1981,1980,1979,1978,1977,1976,1975,1974,1973,1972,1971,1970,1969,1968,1967,1966,1965,1964,1963,1962,1961
Estas estatísticas em outros países:
AfghanistanAlbaniaAlgeriaAngolaAntigua and BarbudaArab WorldArgentinaArmeniaArubaAustraliaAustriaAzerbaijanBahamas, TheBahrainBangladeshBarbadosBelarusBelgiumBelizeBeninBermudaBhutanBoliviaBosnia and HerzegovinaBotswanaBrazilBrunei DarussalamBulgariaBurkina FasoBurundiCabo VerdeCambodiaCameroonCanadaCaribbean small statesCentral African RepublicCentral Europe and the BalticsChadChileChinaColombiaComorosCongo, Dem. Rep.Congo, Rep.Costa RicaCote d'IvoireCroatiaCubaCyprusCzech RepublicDenmarkDjiboutiDominicaDominican RepublicEarly-demographic dividendEast Asia & PacificEast Asia & Pacific (excluding high income)East Asia & Pacific (IDA & IBRD countries)EcuadorEgypt, Arab Rep.El SalvadorEquatorial GuineaEritreaEstoniaEthiopiaEuro areaEurope & Central AsiaEurope & Central Asia (excluding high income)Europe & Central Asia (IDA & IBRD countries)European UnionFaroe IslandsFijiFinlandFragile and conflict affected situationsFranceFrench PolynesiaGabonGambia, TheGeorgiaGermanyGhanaGreeceGrenadaGuatemalaGuineaGuinea-BissauGuyanaHaitiHeavily indebted poor countries (HIPC)High incomeHondurasHong Kong SAR, ChinaHungaryIBRD onlyIcelandIDA & IBRD totalIDA blendIDA onlyIDA totalIndiaIndonesiaIran, Islamic Rep.IraqIrelandIsraelItalyJamaicaJapanJordanKazakhstanKenyaKiribatiKorea, Rep.KosovoKuwaitKyrgyz RepublicLao PDRLate-demographic dividendLatin America & Caribbean Latin America & Caribbean (excluding high income)Latin America & the Caribbean (IDA & IBRD countries)LatviaLeast developed countries: UN classificationLebanonLesothoLiberiaLibyaLithuaniaLow & middle incomeLow incomeLower middle incomeLuxembourgMacao SAR, ChinaMacedonia, FYRMadagascarMalawiMalaysiaMaldivesMaliMaltaMauritaniaMauritiusMexicoMicronesia, Fed. Sts.Middle East & North AfricaMiddle East & North Africa (excluding high income)Middle East & North Africa (IDA & IBRD countries)Middle incomeMoldovaMongoliaMontenegroMoroccoMozambiqueMyanmarNamibiaNepalNetherlandsNew CaledoniaNew ZealandNicaraguaNigerNigeriaNorth AmericaNorwayOECD membersOmanOther small statesPacific island small statesPakistanPalauPanamaPapua New GuineaParaguayPeruPhilippinesPolandPortugalPost-demographic dividendPre-demographic dividendPuerto RicoQatarRomaniaRussian FederationRwandaSamoaSaudi ArabiaSenegalSerbiaSeychellesSierra LeoneSingaporeSlovak RepublicSloveniaSmall statesSolomon IslandsSomaliaSouth AfricaSouth AsiaSouth Asia (IDA & IBRD)South SudanSpainSri LankaSt. Kitts and NevisSt. LuciaSt. Vincent and the GrenadinesSub-Saharan Africa Sub-Saharan Africa (excluding high income)Sub-Saharan Africa (IDA & IBRD countries)SudanSurinameSwazilandSwedenSwitzerlandSyrian Arab RepublicTajikistanTanzaniaThailandTimor-LesteTogoTongaTrinidad and TobagoTunisiaTurkeyTurkmenistanUgandaUkraineUnited Arab EmiratesUnited KingdomUnited StatesUpper middle incomeUruguayUzbekistanVanuatuVenezuela, RBVietnamWest Bank and GazaWorldYemen, Rep.ZambiaZimbabwe Linha do tempo:
Nesta escala de tempo está apresentado um gráfico de 1961 ano até 2016 ano Botswana. Dados de 1960 ano ausente. O número de observações reais por data: 56.
Fonte (nome):
Indicadores de desenvolvimento mundial
Fonte (organização):
World Bank national accounts data, and OECD National Accounts data files.
Categorias:
Economy & Growth, Trade
Foi atualizado:
23 abr 2017 ano
Indicadores de alterações dos valores ao longo dos anos
Mínimo:
65.92
1 jan 1961 ano
Máximo:
124.649
1 jan 1984 ano
Na data de observação
Valor
Mudança absoluta
A alteração em relação ao valor anterior
1 jan 1961 ano
65.92
+65.92
0.0%
1 jan 1962 ano
69.742
+3.822
5.8%
1 jan 1963 ano
72.765
+3.023
4.33%
1 jan 1964 ano
76.34
+3.575
4.91%
1 jan 1965 ano
77.388
+1.048
1.37%
1 jan 1966 ano
82.317
+4.929
6.37%
1 jan 1967 ano
80.217
-2.1
-2.55%
1 jan 1968 ano
75.387
-4.829
-6.02%
1 jan 1969 ano
86.0
+10.613
14.08%
1 jan 1970 ano
75.338
-10.662
-12.4%
1 jan 1971 ano
85.569
+10.232
13.58%
1 jan 1972 ano
94.714
+9.144
10.69%
1 jan 1973 ano
97.915
+3.201
3.38%
1 jan 1974 ano
100.797
+2.882
2.94%
1 jan 1975 ano
105.698
+4.902
4.86%
1 jan 1976 ano
107.386
+1.688
1.6%
1 jan 1977 ano
116.708
+9.322
8.68%
1 jan 1978 ano
120.21
+3.503
3.0%
1 jan 1979 ano
120.585
+0.375
0.31%
1 jan 1980 ano
119.373
-1.212
-1.01%
1 jan 1981 ano
119.502
+0.129
0.11%
1 jan 1982 ano
121.235
+1.734
1.45%
1 jan 1983 ano
123.836
+2.601
2.15%
1 jan 1984 ano
124.649
+0.813
0.66%
1 jan 1985 ano
118.773
-5.876
-4.71%
1 jan 1986 ano
117.523
-1.251
-1.05%
1 jan 1987 ano
117.46
-0.063
-0.05%
1 jan 1988 ano
123.572
+6.112
5.2%
1 jan 1989 ano
114.452
-9.12
-7.38%
1 jan 1990 ano
105.361
-9.091
-7.94%
1 jan 1991 ano
104.847
-0.514
-0.49%
1 jan 1992 ano
99.558
-5.289
-5.04%
1 jan 1993 ano
89.751
-9.807
-9.85%
1 jan 1994 ano
86.208
-3.543
-3.95%
1 jan 1995 ano
88.181
+1.972
2.29%
1 jan 1996 ano
94.595
+6.415
7.27%
1 jan 1997 ano
90.956
-3.64
-3.85%
1 jan 1998 ano
108.604
+17.649
19.4%
1 jan 1999 ano
101.841
-6.763
-6.23%
1 jan 2000 ano
98.929
-2.912
-2.86%
1 jan 2001 ano
91.925
-7.004
-7.08%
1 jan 2002 ano
87.525
-4.4
-4.79%
1 jan 2003 ano
91.836
+4.311
4.93%
1 jan 2004 ano
85.834
-6.002
-6.54%
1 jan 2005 ano
90.998
+5.164
6.02%
1 jan 2006 ano
88.505
-2.492
-2.74%
1 jan 2007 ano
86.335
-2.171
-2.45%
1 jan 2008 ano
95.105
+8.77
10.16%
1 jan 2009 ano
96.716
+1.611
1.69%
1 jan 2010 ano
86.686
-10.03
-10.37%
1 jan 2011 ano
94.9
+8.214
9.48%
1 jan 2012 ano
101.36
+6.461
6.81%
1 jan 2013 ano
108.652
+7.291
7.19%
1 jan 2014 ano
123.787
+15.136
13.93%
1 jan 2015 ano
117.514
-6.274
-5.07%
1 jan 2016 ano
105.946
-11.567
-9.84%
Classificação de países por estatísticas atuais por anos


Comentários: