29
/pt/
pt
AIzaSyAYiBZKx7MnpbEhh9jyipgxe19OcubqV5w
April 1, 2024
27771
East Asia & Pacific
EAS
false
2
1
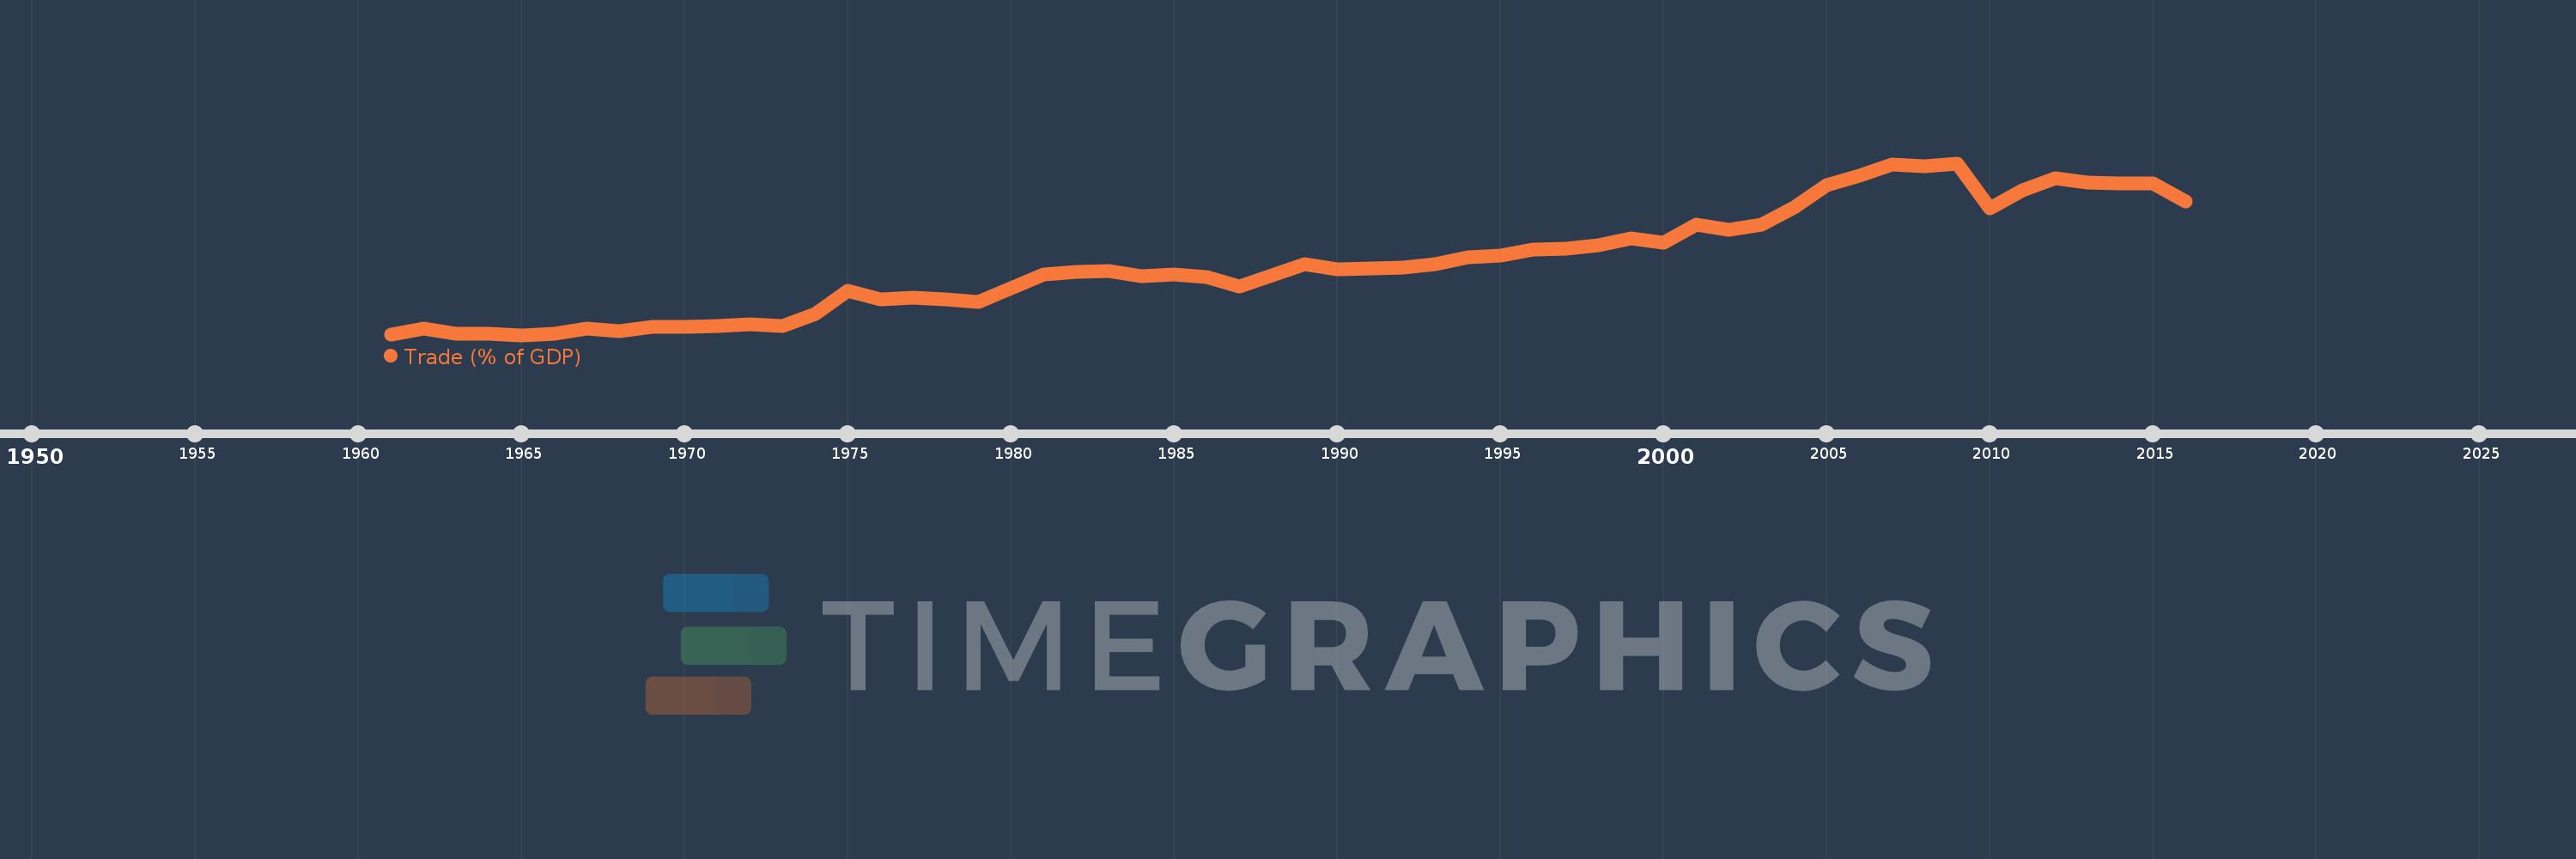
Trade (% of GDP)
2016,2015,2014,2013,2012,2011,2010,2009,2008,2007,2006,2005,2004,2003,2002,2001,2000,1999,1998,1997,1996,1995,1994,1993,1992,1991,1990,1989,1988,1987,1986,1985,1984,1983,1982,1981,1980,1979,1978,1977,1976,1975,1974,1973,1972,1971,1970,1969,1968,1967,1966,1965,1964,1963,1962,1961
Estas estatísticas em outros países:
AfghanistanAlbaniaAlgeriaAngolaAntigua and BarbudaArab WorldArgentinaArmeniaArubaAustraliaAustriaAzerbaijanBahamas, TheBahrainBangladeshBarbadosBelarusBelgiumBelizeBeninBermudaBhutanBoliviaBosnia and HerzegovinaBotswanaBrazilBrunei DarussalamBulgariaBurkina FasoBurundiCabo VerdeCambodiaCameroonCanadaCaribbean small statesCentral African RepublicCentral Europe and the BalticsChadChileChinaColombiaComorosCongo, Dem. Rep.Congo, Rep.Costa RicaCote d'IvoireCroatiaCubaCyprusCzech RepublicDenmarkDjiboutiDominicaDominican RepublicEarly-demographic dividendEast Asia & PacificEast Asia & Pacific (excluding high income)East Asia & Pacific (IDA & IBRD countries)EcuadorEgypt, Arab Rep.El SalvadorEquatorial GuineaEritreaEstoniaEthiopiaEuro areaEurope & Central AsiaEurope & Central Asia (excluding high income)Europe & Central Asia (IDA & IBRD countries)European UnionFaroe IslandsFijiFinlandFragile and conflict affected situationsFranceFrench PolynesiaGabonGambia, TheGeorgiaGermanyGhanaGreeceGrenadaGuatemalaGuineaGuinea-BissauGuyanaHaitiHeavily indebted poor countries (HIPC)High incomeHondurasHong Kong SAR, ChinaHungaryIBRD onlyIcelandIDA & IBRD totalIDA blendIDA onlyIDA totalIndiaIndonesiaIran, Islamic Rep.IraqIrelandIsraelItalyJamaicaJapanJordanKazakhstanKenyaKiribatiKorea, Rep.KosovoKuwaitKyrgyz RepublicLao PDRLate-demographic dividendLatin America & Caribbean Latin America & Caribbean (excluding high income)Latin America & the Caribbean (IDA & IBRD countries)LatviaLeast developed countries: UN classificationLebanonLesothoLiberiaLibyaLithuaniaLow & middle incomeLow incomeLower middle incomeLuxembourgMacao SAR, ChinaMacedonia, FYRMadagascarMalawiMalaysiaMaldivesMaliMaltaMauritaniaMauritiusMexicoMicronesia, Fed. Sts.Middle East & North AfricaMiddle East & North Africa (excluding high income)Middle East & North Africa (IDA & IBRD countries)Middle incomeMoldovaMongoliaMontenegroMoroccoMozambiqueMyanmarNamibiaNepalNetherlandsNew CaledoniaNew ZealandNicaraguaNigerNigeriaNorth AmericaNorwayOECD membersOmanOther small statesPacific island small statesPakistanPalauPanamaPapua New GuineaParaguayPeruPhilippinesPolandPortugalPost-demographic dividendPre-demographic dividendPuerto RicoQatarRomaniaRussian FederationRwandaSamoaSaudi ArabiaSenegalSerbiaSeychellesSierra LeoneSingaporeSlovak RepublicSloveniaSmall statesSolomon IslandsSomaliaSouth AfricaSouth AsiaSouth Asia (IDA & IBRD)South SudanSpainSri LankaSt. Kitts and NevisSt. LuciaSt. Vincent and the GrenadinesSub-Saharan Africa Sub-Saharan Africa (excluding high income)Sub-Saharan Africa (IDA & IBRD countries)SudanSurinameSwazilandSwedenSwitzerlandSyrian Arab RepublicTajikistanTanzaniaThailandTimor-LesteTogoTongaTrinidad and TobagoTunisiaTurkeyTurkmenistanUgandaUkraineUnited Arab EmiratesUnited KingdomUnited StatesUpper middle incomeUruguayUzbekistanVanuatuVenezuela, RBVietnamWest Bank and GazaWorldYemen, Rep.ZambiaZimbabwe Linha do tempo:
Nesta escala de tempo está apresentado um gráfico de 1961 ano até 2016 ano East Asia & Pacific. Dados de 1960 ano ausente. O número de observações reais por data: 56.
Fonte (nome):
Indicadores de desenvolvimento mundial
Fonte (organização):
World Bank national accounts data, and OECD National Accounts data files.
Categorias:
Economy & Growth, Trade
Foi atualizado:
23 abr 2017 ano
Indicadores de alterações dos valores ao longo dos anos
Mínimo:
22.76
1 jan 1965 ano
Máximo:
69.046
1 jan 2009 ano
Na data de observação
Valor
Mudança absoluta
A alteração em relação ao valor anterior
1 jan 1961 ano
22.891
+22.891
0.0%
1 jan 1962 ano
24.42
+1.529
6.68%
1 jan 1963 ano
23.022
-1.398
-5.72%
1 jan 1964 ano
23.022
0.0
0.0%
1 jan 1965 ano
22.76
-0.262
-1.14%
1 jan 1966 ano
23.085
+0.326
1.43%
1 jan 1967 ano
24.556
+1.471
6.37%
1 jan 1968 ano
23.819
-0.737
-3.0%
1 jan 1969 ano
24.874
+1.055
4.43%
1 jan 1970 ano
24.914
+0.04
0.16%
1 jan 1971 ano
25.244
+0.331
1.33%
1 jan 1972 ano
25.663
+0.419
1.66%
1 jan 1973 ano
25.173
-0.49
-1.91%
1 jan 1974 ano
28.541
+3.368
13.38%
1 jan 1975 ano
34.719
+6.178
21.65%
1 jan 1976 ano
32.264
-2.455
-7.07%
1 jan 1977 ano
32.904
+0.64
1.98%
1 jan 1978 ano
32.376
-0.528
-1.6%
1 jan 1979 ano
31.697
-0.679
-2.1%
1 jan 1980 ano
35.265
+3.568
11.26%
1 jan 1981 ano
38.97
+3.705
10.51%
1 jan 1982 ano
39.752
+0.782
2.01%
1 jan 1983 ano
40.09
+0.338
0.85%
1 jan 1984 ano
38.53
-1.56
-3.89%
1 jan 1985 ano
39.005
+0.475
1.23%
1 jan 1986 ano
38.404
-0.601
-1.54%
1 jan 1987 ano
35.758
-2.646
-6.89%
1 jan 1988 ano
38.786
+3.028
8.47%
1 jan 1989 ano
41.782
+2.996
7.73%
1 jan 1990 ano
40.458
-1.324
-3.17%
1 jan 1991 ano
40.609
+0.151
0.37%
1 jan 1992 ano
40.917
+0.308
0.76%
1 jan 1993 ano
41.841
+0.924
2.26%
1 jan 1994 ano
43.663
+1.823
4.36%
1 jan 1995 ano
44.183
+0.52
1.19%
1 jan 1996 ano
45.698
+1.514
3.43%
1 jan 1997 ano
45.914
+0.217
0.47%
1 jan 1998 ano
46.869
+0.955
2.08%
1 jan 1999 ano
48.878
+2.009
4.29%
1 jan 2000 ano
47.631
-1.247
-2.55%
1 jan 2001 ano
52.586
+4.954
10.4%
1 jan 2002 ano
51.204
-1.382
-2.63%
1 jan 2003 ano
52.384
+1.18
2.3%
1 jan 2004 ano
57.177
+4.793
9.15%
1 jan 2005 ano
63.23
+6.053
10.59%
1 jan 2006 ano
65.778
+2.548
4.03%
1 jan 2007 ano
68.621
+2.844
4.32%
1 jan 2008 ano
68.24
-0.382
-0.56%
1 jan 2009 ano
69.046
+0.807
1.18%
1 jan 2010 ano
56.797
-12.249
-17.74%
1 jan 2011 ano
61.852
+5.055
8.9%
1 jan 2012 ano
64.91
+3.058
4.94%
1 jan 2013 ano
63.802
-1.108
-1.71%
1 jan 2014 ano
63.645
-0.157
-0.25%
1 jan 2015 ano
63.714
+0.069
0.11%
1 jan 2016 ano
58.79
-4.924
-7.73%
Classificação de países por estatísticas atuais por anos


Comentários: