29
/pt/
pt
AIzaSyAYiBZKx7MnpbEhh9jyipgxe19OcubqV5w
April 1, 2024
253761
Sudan
SDN
true
2
1
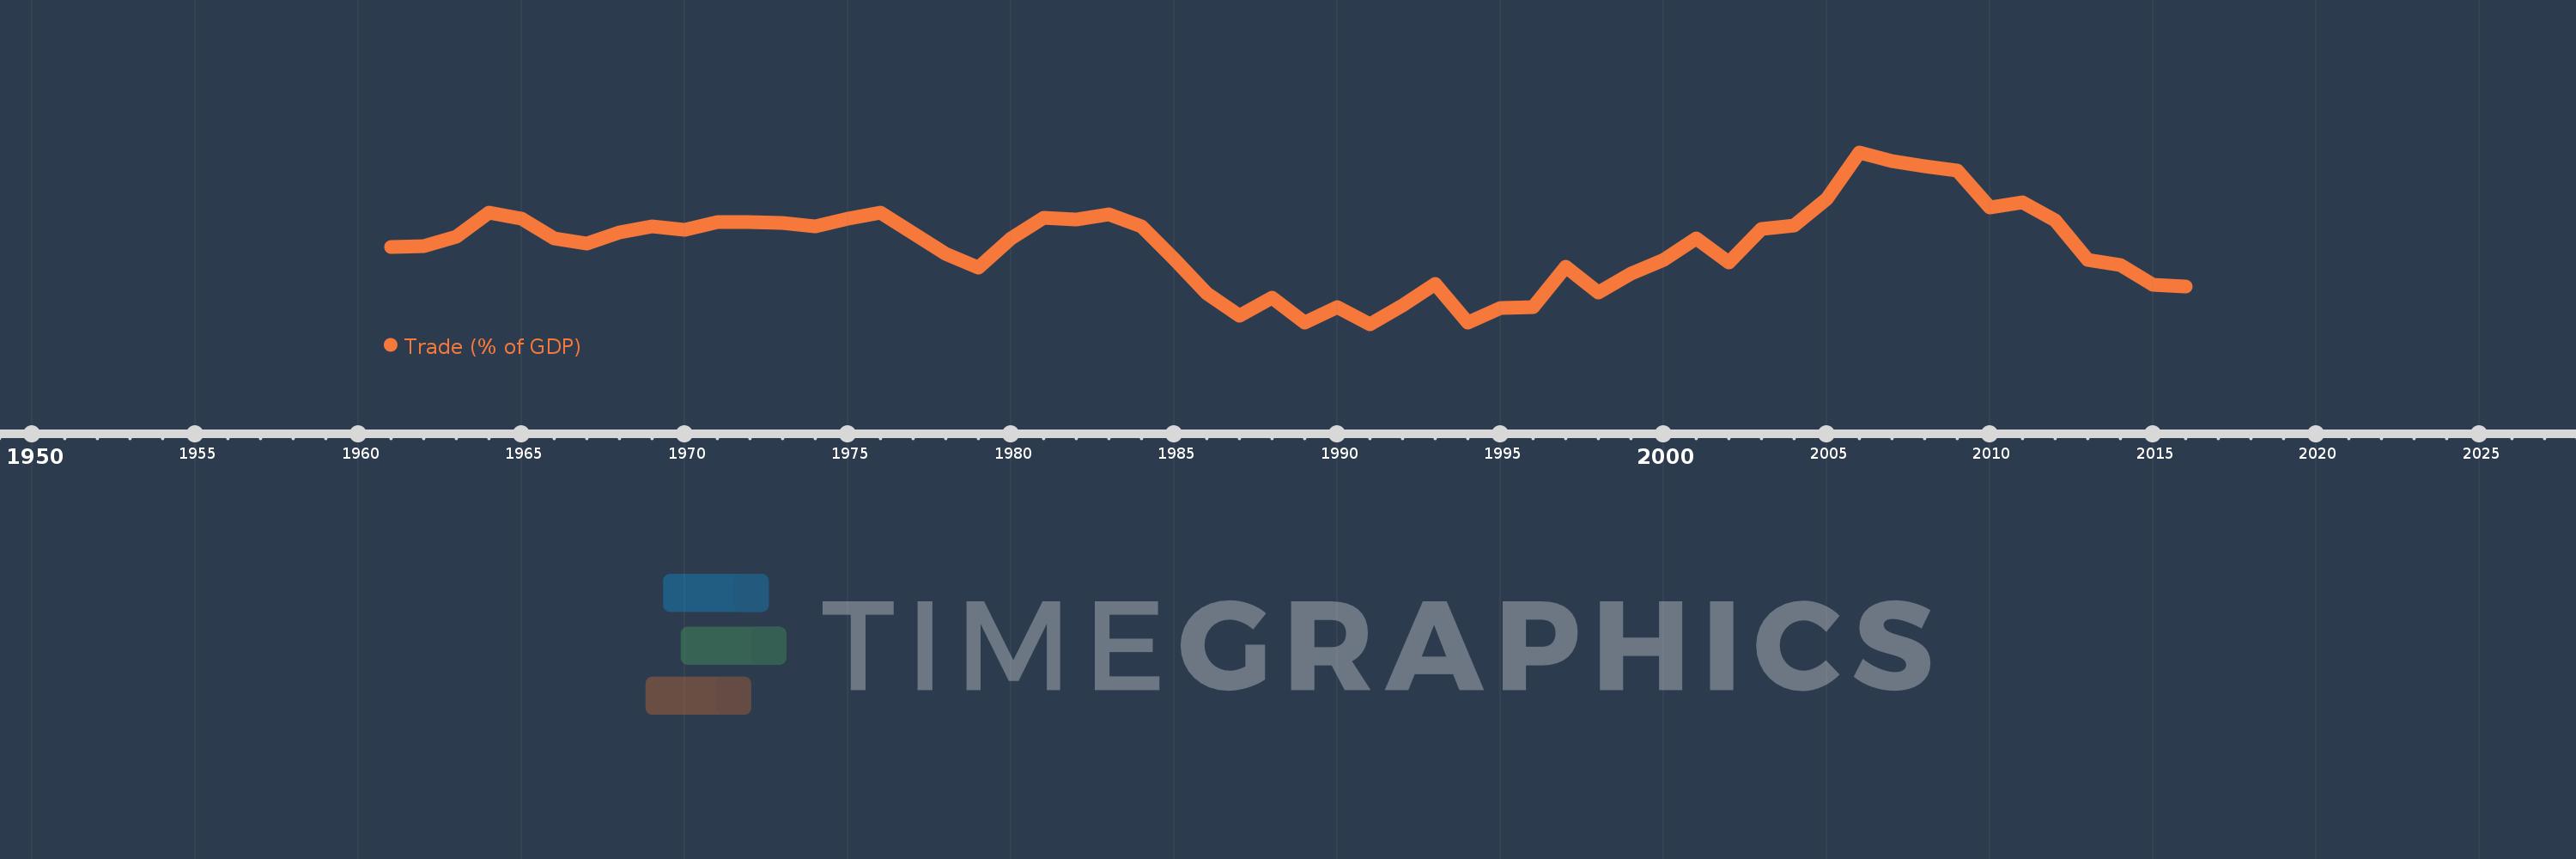
Trade (% of GDP)
2016,2015,2014,2013,2012,2011,2010,2009,2008,2007,2006,2005,2004,2003,2002,2001,2000,1999,1998,1997,1996,1995,1994,1993,1992,1991,1990,1989,1988,1987,1986,1985,1984,1983,1982,1981,1980,1979,1978,1977,1976,1975,1974,1973,1972,1971,1970,1969,1968,1967,1966,1965,1964,1963,1962,1961
Estas estatísticas em outros países:
AfghanistanAlbaniaAlgeriaAngolaAntigua and BarbudaArab WorldArgentinaArmeniaArubaAustraliaAustriaAzerbaijanBahamas, TheBahrainBangladeshBarbadosBelarusBelgiumBelizeBeninBermudaBhutanBoliviaBosnia and HerzegovinaBotswanaBrazilBrunei DarussalamBulgariaBurkina FasoBurundiCabo VerdeCambodiaCameroonCanadaCaribbean small statesCentral African RepublicCentral Europe and the BalticsChadChileChinaColombiaComorosCongo, Dem. Rep.Congo, Rep.Costa RicaCote d'IvoireCroatiaCubaCyprusCzech RepublicDenmarkDjiboutiDominicaDominican RepublicEarly-demographic dividendEast Asia & PacificEast Asia & Pacific (excluding high income)East Asia & Pacific (IDA & IBRD countries)EcuadorEgypt, Arab Rep.El SalvadorEquatorial GuineaEritreaEstoniaEthiopiaEuro areaEurope & Central AsiaEurope & Central Asia (excluding high income)Europe & Central Asia (IDA & IBRD countries)European UnionFaroe IslandsFijiFinlandFragile and conflict affected situationsFranceFrench PolynesiaGabonGambia, TheGeorgiaGermanyGhanaGreeceGrenadaGuatemalaGuineaGuinea-BissauGuyanaHaitiHeavily indebted poor countries (HIPC)High incomeHondurasHong Kong SAR, ChinaHungaryIBRD onlyIcelandIDA & IBRD totalIDA blendIDA onlyIDA totalIndiaIndonesiaIran, Islamic Rep.IraqIrelandIsraelItalyJamaicaJapanJordanKazakhstanKenyaKiribatiKorea, Rep.KosovoKuwaitKyrgyz RepublicLao PDRLate-demographic dividendLatin America & Caribbean Latin America & Caribbean (excluding high income)Latin America & the Caribbean (IDA & IBRD countries)LatviaLeast developed countries: UN classificationLebanonLesothoLiberiaLibyaLithuaniaLow & middle incomeLow incomeLower middle incomeLuxembourgMacao SAR, ChinaMacedonia, FYRMadagascarMalawiMalaysiaMaldivesMaliMaltaMauritaniaMauritiusMexicoMicronesia, Fed. Sts.Middle East & North AfricaMiddle East & North Africa (excluding high income)Middle East & North Africa (IDA & IBRD countries)Middle incomeMoldovaMongoliaMontenegroMoroccoMozambiqueMyanmarNamibiaNepalNetherlandsNew CaledoniaNew ZealandNicaraguaNigerNigeriaNorth AmericaNorwayOECD membersOmanOther small statesPacific island small statesPakistanPalauPanamaPapua New GuineaParaguayPeruPhilippinesPolandPortugalPost-demographic dividendPre-demographic dividendPuerto RicoQatarRomaniaRussian FederationRwandaSamoaSaudi ArabiaSenegalSerbiaSeychellesSierra LeoneSingaporeSlovak RepublicSloveniaSmall statesSolomon IslandsSomaliaSouth AfricaSouth AsiaSouth Asia (IDA & IBRD)South SudanSpainSri LankaSt. Kitts and NevisSt. LuciaSt. Vincent and the GrenadinesSub-Saharan Africa Sub-Saharan Africa (excluding high income)Sub-Saharan Africa (IDA & IBRD countries)SudanSurinameSwazilandSwedenSwitzerlandSyrian Arab RepublicTajikistanTanzaniaThailandTimor-LesteTogoTongaTrinidad and TobagoTunisiaTurkeyTurkmenistanUgandaUkraineUnited Arab EmiratesUnited KingdomUnited StatesUpper middle incomeUruguayUzbekistanVanuatuVenezuela, RBVietnamWest Bank and GazaWorldYemen, Rep.ZambiaZimbabwe Linha do tempo:
Nesta escala de tempo está apresentado um gráfico de 1961 ano até 2016 ano Sudan. Dados de 1960 ano ausente. O número de observações reais por data: 56.
Fonte (nome):
Indicadores de desenvolvimento mundial
Fonte (organização):
World Bank national accounts data, and OECD National Accounts data files.
Categorias:
Economy & Growth, Trade
Foi atualizado:
23 abr 2017 ano
Indicadores de alterações dos valores ao longo dos anos
Mínimo:
11.087
1 jan 1991 ano
Máximo:
47.58
1 jan 2006 ano
Na data de observação
Valor
Mudança absoluta
A alteração em relação ao valor anterior
1 jan 1961 ano
27.562
+27.562
0.0%
1 jan 1962 ano
27.666
+0.103
0.37%
1 jan 1963 ano
29.665
+1.999
7.23%
1 jan 1964 ano
34.75
+5.085
17.14%
1 jan 1965 ano
33.471
-1.279
-3.68%
1 jan 1966 ano
29.277
-4.194
-12.53%
1 jan 1967 ano
28.265
-1.013
-3.46%
1 jan 1968 ano
30.659
+2.395
8.47%
1 jan 1969 ano
31.958
+1.299
4.24%
1 jan 1970 ano
31.105
-0.853
-2.67%
1 jan 1971 ano
32.75
+1.645
5.29%
1 jan 1972 ano
32.819
+0.069
0.21%
1 jan 1973 ano
32.686
-0.133
-0.41%
1 jan 1974 ano
31.871
-0.814
-2.49%
1 jan 1975 ano
33.435
+1.564
4.91%
1 jan 1976 ano
34.798
+1.363
4.08%
1 jan 1977 ano
30.366
-4.432
-12.74%
1 jan 1978 ano
26.003
-4.362
-14.37%
1 jan 1979 ano
23.134
-2.869
-11.03%
1 jan 1980 ano
29.312
+6.178
26.7%
1 jan 1981 ano
33.727
+4.416
15.06%
1 jan 1982 ano
33.272
-0.456
-1.35%
1 jan 1983 ano
34.353
+1.081
3.25%
1 jan 1984 ano
31.838
-2.515
-7.32%
1 jan 1985 ano
24.927
-6.911
-21.71%
1 jan 1986 ano
17.628
-7.299
-29.28%
1 jan 1987 ano
12.962
-4.666
-26.47%
1 jan 1988 ano
16.657
+3.694
28.5%
1 jan 1989 ano
11.488
-5.169
-31.03%
1 jan 1990 ano
14.685
+3.197
27.83%
1 jan 1991 ano
11.087
-3.598
-24.5%
1 jan 1992 ano
15.071
+3.984
35.93%
1 jan 1993 ano
19.67
+4.599
30.51%
1 jan 1994 ano
11.466
-8.204
-41.71%
1 jan 1995 ano
14.61
+3.144
27.42%
1 jan 1996 ano
14.772
+0.162
1.11%
1 jan 1997 ano
23.206
+8.434
57.09%
1 jan 1998 ano
17.859
-5.347
-23.04%
1 jan 1999 ano
21.875
+4.017
22.49%
1 jan 2000 ano
24.714
+2.839
12.98%
1 jan 2001 ano
29.404
+4.69
18.98%
1 jan 2002 ano
24.193
-5.211
-17.72%
1 jan 2003 ano
31.396
+7.203
29.77%
1 jan 2004 ano
31.998
+0.601
1.92%
1 jan 2005 ano
37.79
+5.793
18.1%
1 jan 2006 ano
47.58
+9.79
25.91%
1 jan 2007 ano
45.745
-1.835
-3.86%
1 jan 2008 ano
44.553
-1.192
-2.61%
1 jan 2009 ano
43.685
-0.868
-1.95%
1 jan 2010 ano
35.967
-7.718
-17.67%
1 jan 2011 ano
36.976
+1.009
2.8%
1 jan 2012 ano
33.112
-3.864
-10.45%
1 jan 2013 ano
24.721
-8.391
-25.34%
1 jan 2014 ano
23.729
-0.992
-4.01%
1 jan 2015 ano
19.459
-4.27
-17.99%
1 jan 2016 ano
19.101
-0.358
-1.84%
Classificação de países por estatísticas atuais por anos


Comentários: