29
/pt/
pt
AIzaSyAYiBZKx7MnpbEhh9jyipgxe19OcubqV5w
April 1, 2024
26976
Early-demographic dividend
EAR
false
2
1
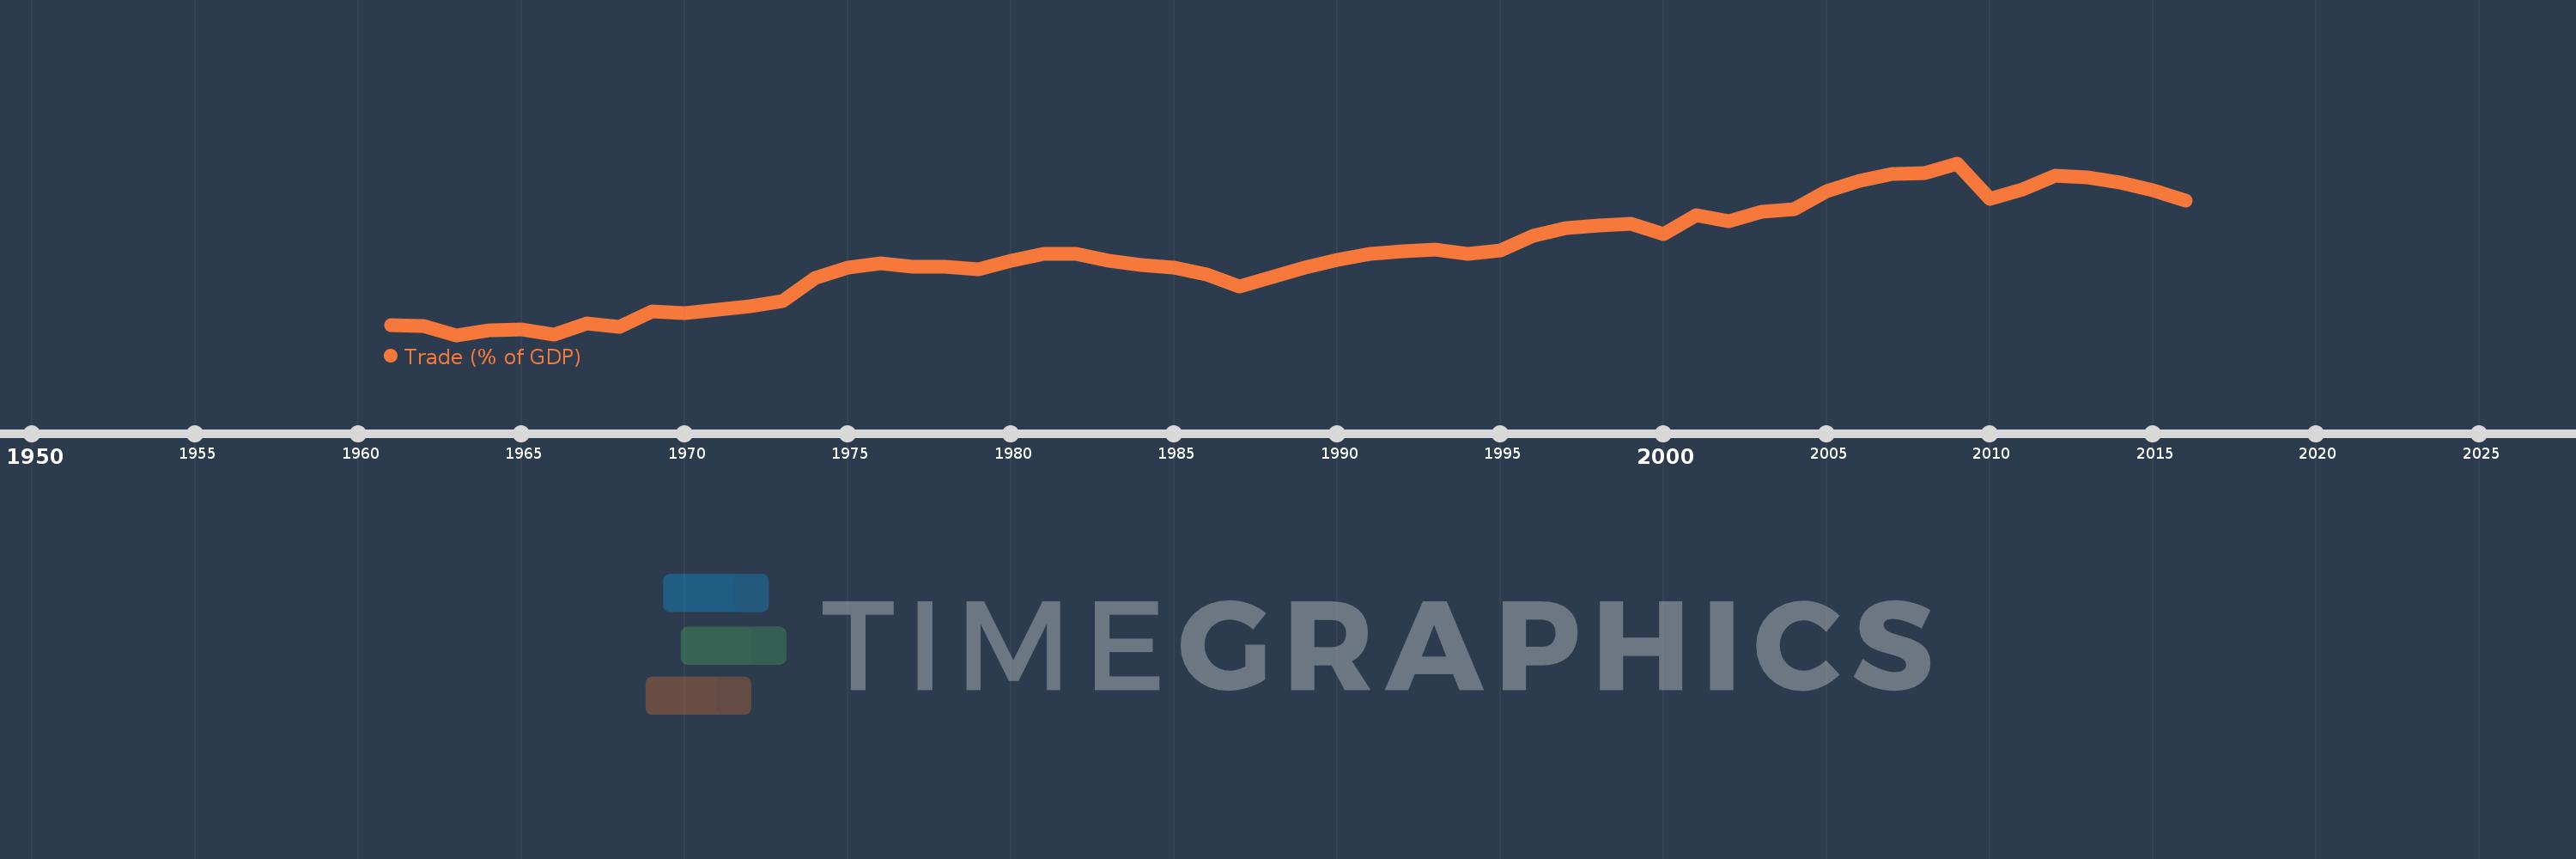
Trade (% of GDP)
2016,2015,2014,2013,2012,2011,2010,2009,2008,2007,2006,2005,2004,2003,2002,2001,2000,1999,1998,1997,1996,1995,1994,1993,1992,1991,1990,1989,1988,1987,1986,1985,1984,1983,1982,1981,1980,1979,1978,1977,1976,1975,1974,1973,1972,1971,1970,1969,1968,1967,1966,1965,1964,1963,1962,1961
Estas estatísticas em outros países:
AfghanistanAlbaniaAlgeriaAngolaAntigua and BarbudaArab WorldArgentinaArmeniaArubaAustraliaAustriaAzerbaijanBahamas, TheBahrainBangladeshBarbadosBelarusBelgiumBelizeBeninBermudaBhutanBoliviaBosnia and HerzegovinaBotswanaBrazilBrunei DarussalamBulgariaBurkina FasoBurundiCabo VerdeCambodiaCameroonCanadaCaribbean small statesCentral African RepublicCentral Europe and the BalticsChadChileChinaColombiaComorosCongo, Dem. Rep.Congo, Rep.Costa RicaCote d'IvoireCroatiaCubaCyprusCzech RepublicDenmarkDjiboutiDominicaDominican RepublicEarly-demographic dividendEast Asia & PacificEast Asia & Pacific (excluding high income)East Asia & Pacific (IDA & IBRD countries)EcuadorEgypt, Arab Rep.El SalvadorEquatorial GuineaEritreaEstoniaEthiopiaEuro areaEurope & Central AsiaEurope & Central Asia (excluding high income)Europe & Central Asia (IDA & IBRD countries)European UnionFaroe IslandsFijiFinlandFragile and conflict affected situationsFranceFrench PolynesiaGabonGambia, TheGeorgiaGermanyGhanaGreeceGrenadaGuatemalaGuineaGuinea-BissauGuyanaHaitiHeavily indebted poor countries (HIPC)High incomeHondurasHong Kong SAR, ChinaHungaryIBRD onlyIcelandIDA & IBRD totalIDA blendIDA onlyIDA totalIndiaIndonesiaIran, Islamic Rep.IraqIrelandIsraelItalyJamaicaJapanJordanKazakhstanKenyaKiribatiKorea, Rep.KosovoKuwaitKyrgyz RepublicLao PDRLate-demographic dividendLatin America & Caribbean Latin America & Caribbean (excluding high income)Latin America & the Caribbean (IDA & IBRD countries)LatviaLeast developed countries: UN classificationLebanonLesothoLiberiaLibyaLithuaniaLow & middle incomeLow incomeLower middle incomeLuxembourgMacao SAR, ChinaMacedonia, FYRMadagascarMalawiMalaysiaMaldivesMaliMaltaMauritaniaMauritiusMexicoMicronesia, Fed. Sts.Middle East & North AfricaMiddle East & North Africa (excluding high income)Middle East & North Africa (IDA & IBRD countries)Middle incomeMoldovaMongoliaMontenegroMoroccoMozambiqueMyanmarNamibiaNepalNetherlandsNew CaledoniaNew ZealandNicaraguaNigerNigeriaNorth AmericaNorwayOECD membersOmanOther small statesPacific island small statesPakistanPalauPanamaPapua New GuineaParaguayPeruPhilippinesPolandPortugalPost-demographic dividendPre-demographic dividendPuerto RicoQatarRomaniaRussian FederationRwandaSamoaSaudi ArabiaSenegalSerbiaSeychellesSierra LeoneSingaporeSlovak RepublicSloveniaSmall statesSolomon IslandsSomaliaSouth AfricaSouth AsiaSouth Asia (IDA & IBRD)South SudanSpainSri LankaSt. Kitts and NevisSt. LuciaSt. Vincent and the GrenadinesSub-Saharan Africa Sub-Saharan Africa (excluding high income)Sub-Saharan Africa (IDA & IBRD countries)SudanSurinameSwazilandSwedenSwitzerlandSyrian Arab RepublicTajikistanTanzaniaThailandTimor-LesteTogoTongaTrinidad and TobagoTunisiaTurkeyTurkmenistanUgandaUkraineUnited Arab EmiratesUnited KingdomUnited StatesUpper middle incomeUruguayUzbekistanVanuatuVenezuela, RBVietnamWest Bank and GazaWorldYemen, Rep.ZambiaZimbabwe Linha do tempo:
Nesta escala de tempo está apresentado um gráfico de 1961 ano até 2016 ano Early-demographic dividend. Dados de 1960 ano ausente. O número de observações reais por data: 56.
Fonte (nome):
Indicadores de desenvolvimento mundial
Fonte (organização):
World Bank national accounts data, and OECD National Accounts data files.
Categorias:
Economy & Growth, Trade
Foi atualizado:
23 abr 2017 ano
Indicadores de alterações dos valores ao longo dos anos
Mínimo:
22.57
1 jan 1963 ano
Máximo:
61.524
1 jan 2009 ano
Na data de observação
Valor
Mudança absoluta
A alteração em relação ao valor anterior
1 jan 1961 ano
24.798
+24.798
0.0%
1 jan 1962 ano
24.583
-0.215
-0.87%
1 jan 1963 ano
22.57
-2.013
-8.19%
1 jan 1964 ano
23.616
+1.046
4.64%
1 jan 1965 ano
23.75
+0.133
0.56%
1 jan 1966 ano
22.744
-1.005
-4.23%
1 jan 1967 ano
25.164
+2.42
10.64%
1 jan 1968 ano
24.506
-0.658
-2.62%
1 jan 1969 ano
27.989
+3.483
14.21%
1 jan 1970 ano
27.515
-0.473
-1.69%
1 jan 1971 ano
28.374
+0.858
3.12%
1 jan 1972 ano
29.08
+0.706
2.49%
1 jan 1973 ano
30.303
+1.223
4.21%
1 jan 1974 ano
35.537
+5.235
17.27%
1 jan 1975 ano
37.949
+2.412
6.79%
1 jan 1976 ano
38.738
+0.789
2.08%
1 jan 1977 ano
37.988
-0.749
-1.93%
1 jan 1978 ano
38.142
+0.154
0.41%
1 jan 1979 ano
37.533
-0.61
-1.6%
1 jan 1980 ano
39.472
+1.939
5.17%
1 jan 1981 ano
41.058
+1.586
4.02%
1 jan 1982 ano
40.923
-0.135
-0.33%
1 jan 1983 ano
39.354
-1.569
-3.83%
1 jan 1984 ano
38.36
-0.994
-2.53%
1 jan 1985 ano
37.813
-0.547
-1.43%
1 jan 1986 ano
36.221
-1.592
-4.21%
1 jan 1987 ano
33.66
-2.561
-7.07%
1 jan 1988 ano
35.808
+2.149
6.38%
1 jan 1989 ano
37.919
+2.111
5.89%
1 jan 1990 ano
39.655
+1.736
4.58%
1 jan 1991 ano
40.994
+1.339
3.38%
1 jan 1992 ano
41.58
+0.586
1.43%
1 jan 1993 ano
41.868
+0.288
0.69%
1 jan 1994 ano
40.936
-0.932
-2.23%
1 jan 1995 ano
41.717
+0.781
1.91%
1 jan 1996 ano
45.04
+3.323
7.97%
1 jan 1997 ano
46.736
+1.695
3.76%
1 jan 1998 ano
47.458
+0.723
1.55%
1 jan 1999 ano
47.874
+0.416
0.88%
1 jan 2000 ano
45.449
-2.425
-5.07%
1 jan 2001 ano
49.65
+4.201
9.24%
1 jan 2002 ano
48.385
-1.265
-2.55%
1 jan 2003 ano
50.57
+2.186
4.52%
1 jan 2004 ano
51.166
+0.596
1.18%
1 jan 2005 ano
55.29
+4.124
8.06%
1 jan 2006 ano
57.552
+2.262
4.09%
1 jan 2007 ano
59.029
+1.477
2.57%
1 jan 2008 ano
59.263
+0.234
0.4%
1 jan 2009 ano
61.524
+2.261
3.82%
1 jan 2010 ano
53.508
-8.016
-13.03%
1 jan 2011 ano
55.549
+2.041
3.81%
1 jan 2012 ano
58.735
+3.186
5.74%
1 jan 2013 ano
58.257
-0.478
-0.81%
1 jan 2014 ano
57.148
-1.109
-1.9%
1 jan 2015 ano
55.386
-1.762
-3.08%
1 jan 2016 ano
53.085
-2.301
-4.15%
Classificação de países por estatísticas atuais por anos


Comentários: