29
/pt/
pt
AIzaSyAYiBZKx7MnpbEhh9jyipgxe19OcubqV5w
April 1, 2024
249563
Sri Lanka
LKA
true
2
1
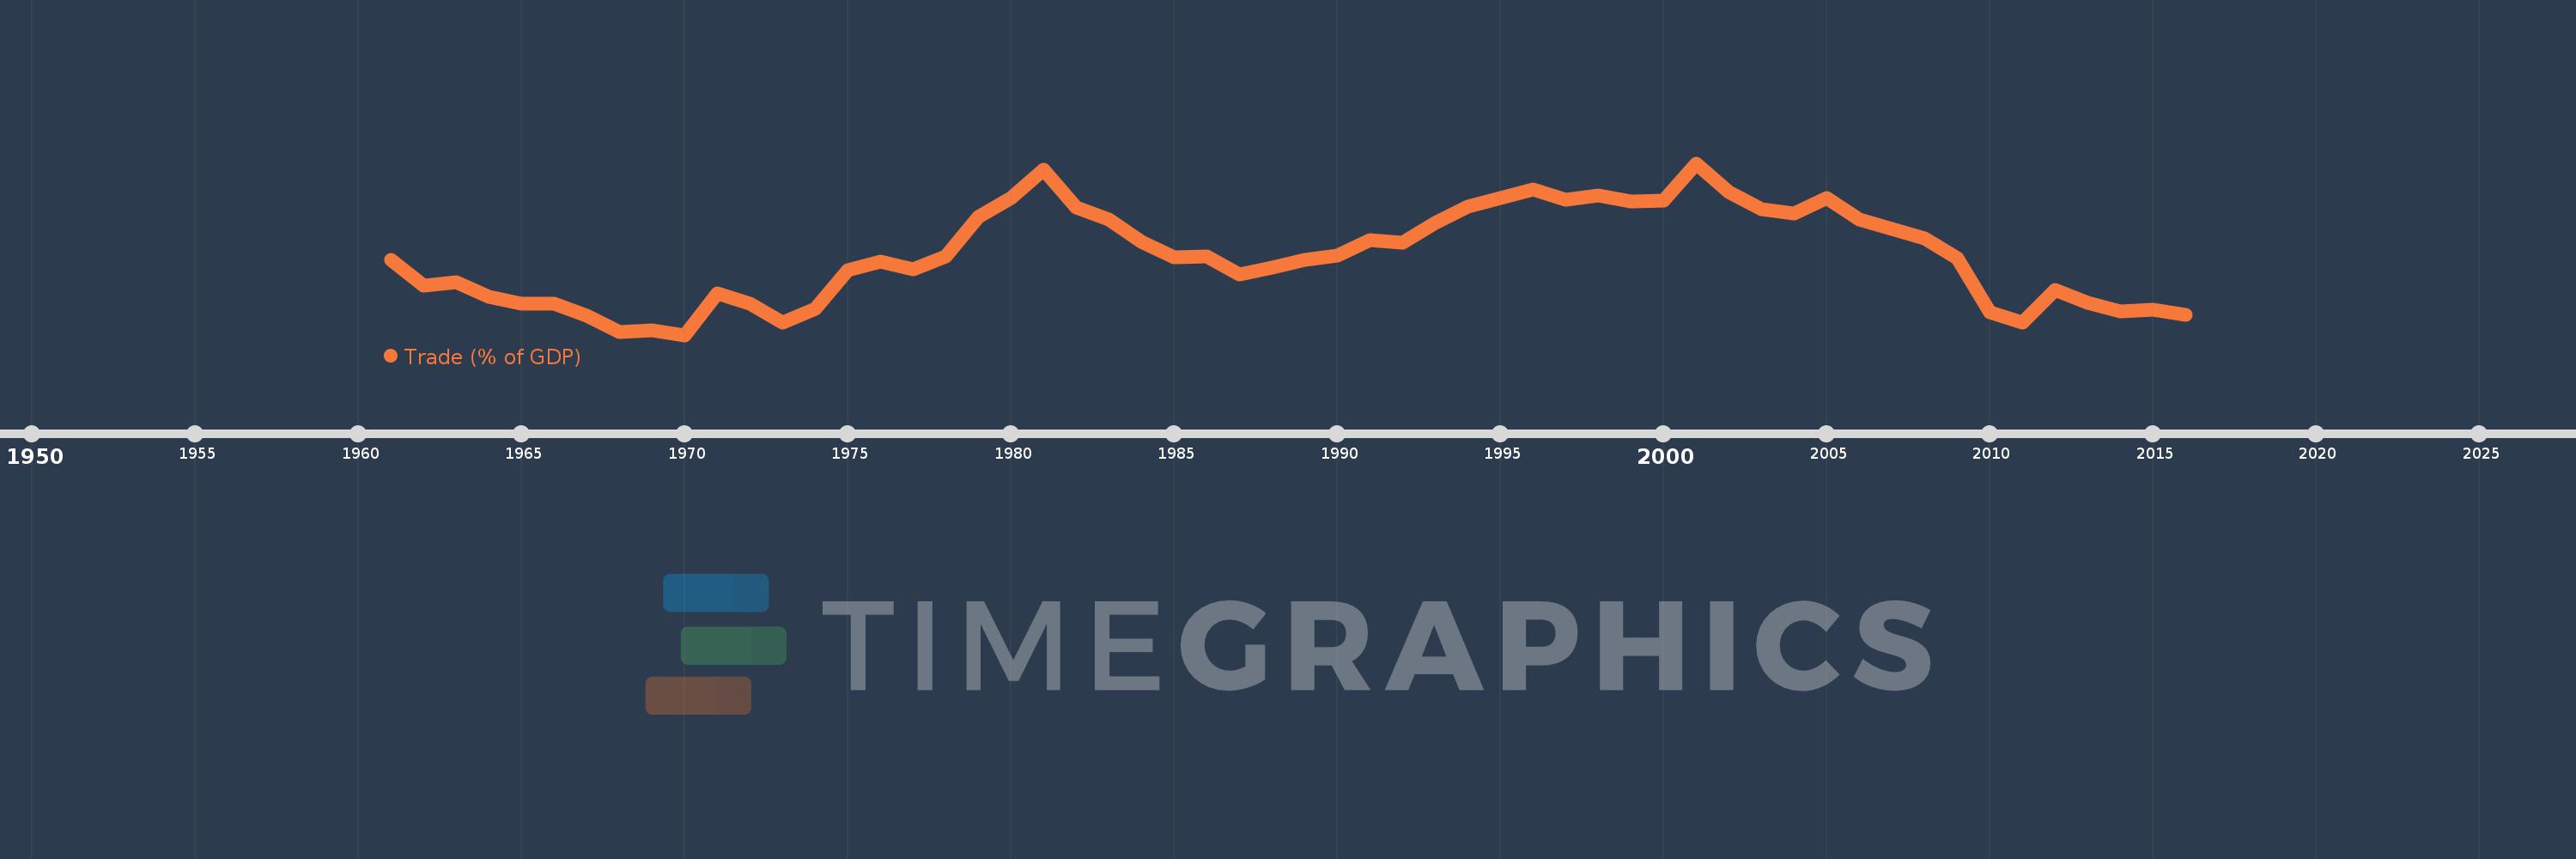
Trade (% of GDP)
2016,2015,2014,2013,2012,2011,2010,2009,2008,2007,2006,2005,2004,2003,2002,2001,2000,1999,1998,1997,1996,1995,1994,1993,1992,1991,1990,1989,1988,1987,1986,1985,1984,1983,1982,1981,1980,1979,1978,1977,1976,1975,1974,1973,1972,1971,1970,1969,1968,1967,1966,1965,1964,1963,1962,1961
Estas estatísticas em outros países:
AfghanistanAlbaniaAlgeriaAngolaAntigua and BarbudaArab WorldArgentinaArmeniaArubaAustraliaAustriaAzerbaijanBahamas, TheBahrainBangladeshBarbadosBelarusBelgiumBelizeBeninBermudaBhutanBoliviaBosnia and HerzegovinaBotswanaBrazilBrunei DarussalamBulgariaBurkina FasoBurundiCabo VerdeCambodiaCameroonCanadaCaribbean small statesCentral African RepublicCentral Europe and the BalticsChadChileChinaColombiaComorosCongo, Dem. Rep.Congo, Rep.Costa RicaCote d'IvoireCroatiaCubaCyprusCzech RepublicDenmarkDjiboutiDominicaDominican RepublicEarly-demographic dividendEast Asia & PacificEast Asia & Pacific (excluding high income)East Asia & Pacific (IDA & IBRD countries)EcuadorEgypt, Arab Rep.El SalvadorEquatorial GuineaEritreaEstoniaEthiopiaEuro areaEurope & Central AsiaEurope & Central Asia (excluding high income)Europe & Central Asia (IDA & IBRD countries)European UnionFaroe IslandsFijiFinlandFragile and conflict affected situationsFranceFrench PolynesiaGabonGambia, TheGeorgiaGermanyGhanaGreeceGrenadaGuatemalaGuineaGuinea-BissauGuyanaHaitiHeavily indebted poor countries (HIPC)High incomeHondurasHong Kong SAR, ChinaHungaryIBRD onlyIcelandIDA & IBRD totalIDA blendIDA onlyIDA totalIndiaIndonesiaIran, Islamic Rep.IraqIrelandIsraelItalyJamaicaJapanJordanKazakhstanKenyaKiribatiKorea, Rep.KosovoKuwaitKyrgyz RepublicLao PDRLate-demographic dividendLatin America & Caribbean Latin America & Caribbean (excluding high income)Latin America & the Caribbean (IDA & IBRD countries)LatviaLeast developed countries: UN classificationLebanonLesothoLiberiaLibyaLithuaniaLow & middle incomeLow incomeLower middle incomeLuxembourgMacao SAR, ChinaMacedonia, FYRMadagascarMalawiMalaysiaMaldivesMaliMaltaMauritaniaMauritiusMexicoMicronesia, Fed. Sts.Middle East & North AfricaMiddle East & North Africa (excluding high income)Middle East & North Africa (IDA & IBRD countries)Middle incomeMoldovaMongoliaMontenegroMoroccoMozambiqueMyanmarNamibiaNepalNetherlandsNew CaledoniaNew ZealandNicaraguaNigerNigeriaNorth AmericaNorwayOECD membersOmanOther small statesPacific island small statesPakistanPalauPanamaPapua New GuineaParaguayPeruPhilippinesPolandPortugalPost-demographic dividendPre-demographic dividendPuerto RicoQatarRomaniaRussian FederationRwandaSamoaSaudi ArabiaSenegalSerbiaSeychellesSierra LeoneSingaporeSlovak RepublicSloveniaSmall statesSolomon IslandsSomaliaSouth AfricaSouth AsiaSouth Asia (IDA & IBRD)South SudanSpainSri LankaSt. Kitts and NevisSt. LuciaSt. Vincent and the GrenadinesSub-Saharan Africa Sub-Saharan Africa (excluding high income)Sub-Saharan Africa (IDA & IBRD countries)SudanSurinameSwazilandSwedenSwitzerlandSyrian Arab RepublicTajikistanTanzaniaThailandTimor-LesteTogoTongaTrinidad and TobagoTunisiaTurkeyTurkmenistanUgandaUkraineUnited Arab EmiratesUnited KingdomUnited StatesUpper middle incomeUruguayUzbekistanVanuatuVenezuela, RBVietnamWest Bank and GazaWorldYemen, Rep.ZambiaZimbabwe Linha do tempo:
Nesta escala de tempo está apresentado um gráfico de 1961 ano até 2016 ano Sri Lanka. Dados de 1960 ano ausente. O número de observações reais por data: 56.
Fonte (nome):
Indicadores de desenvolvimento mundial
Fonte (organização):
World Bank national accounts data, and OECD National Accounts data files.
Categorias:
Economy & Growth, Trade
Foi atualizado:
23 abr 2017 ano
Indicadores de alterações dos valores ao longo dos anos
Mínimo:
43.01
1 jan 1970 ano
Máximo:
88.636
1 jan 2001 ano
Na data de observação
Valor
Mudança absoluta
A alteração em relação ao valor anterior
1 jan 1961 ano
62.866
+62.866
0.0%
1 jan 1962 ano
56.023
-6.843
-10.88%
1 jan 1963 ano
56.994
+0.971
1.73%
1 jan 1964 ano
53.249
-3.745
-6.57%
1 jan 1965 ano
51.337
-1.912
-3.59%
1 jan 1966 ano
51.398
+0.061
0.12%
1 jan 1967 ano
48.219
-3.179
-6.19%
1 jan 1968 ano
43.765
-4.454
-9.24%
1 jan 1969 ano
44.21
+0.446
1.02%
1 jan 1970 ano
43.01
-1.2
-2.71%
1 jan 1971 ano
54.054
+11.045
25.68%
1 jan 1972 ano
51.224
-2.83
-5.24%
1 jan 1973 ano
46.225
-4.999
-9.76%
1 jan 1974 ano
49.908
+3.682
7.97%
1 jan 1975 ano
60.33
+10.422
20.88%
1 jan 1976 ano
62.449
+2.119
3.51%
1 jan 1977 ano
60.428
-2.021
-3.24%
1 jan 1978 ano
63.971
+3.543
5.86%
1 jan 1979 ano
74.316
+10.345
16.17%
1 jan 1980 ano
79.464
+5.148
6.93%
1 jan 1981 ano
87.017
+7.553
9.5%
1 jan 1982 ano
76.995
-10.022
-11.52%
1 jan 1983 ano
73.614
-3.382
-4.39%
1 jan 1984 ano
67.76
-5.854
-7.95%
1 jan 1985 ano
63.548
-4.212
-6.22%
1 jan 1986 ano
63.977
+0.43
0.68%
1 jan 1987 ano
59.048
-4.93
-7.71%
1 jan 1988 ano
60.889
+1.841
3.12%
1 jan 1989 ano
62.913
+2.025
3.33%
1 jan 1990 ano
64.017
+1.104
1.75%
1 jan 1991 ano
68.244
+4.227
6.6%
1 jan 1992 ano
67.596
-0.648
-0.95%
1 jan 1993 ano
72.804
+5.208
7.7%
1 jan 1994 ano
77.148
+4.344
5.97%
1 jan 1995 ano
79.431
+2.283
2.96%
1 jan 1996 ano
81.635
+2.204
2.78%
1 jan 1997 ano
78.874
-2.761
-3.38%
1 jan 1998 ano
80.138
+1.264
1.6%
1 jan 1999 ano
78.495
-1.643
-2.05%
1 jan 2000 ano
78.751
+0.256
0.33%
1 jan 2001 ano
88.636
+9.885
12.55%
1 jan 2002 ano
80.899
-7.738
-8.73%
1 jan 2003 ano
76.335
-4.563
-5.64%
1 jan 2004 ano
75.336
-0.999
-1.31%
1 jan 2005 ano
79.483
+4.147
5.5%
1 jan 2006 ano
73.604
-5.879
-7.4%
1 jan 2007 ano
71.261
-2.343
-3.18%
1 jan 2008 ano
68.607
-2.655
-3.73%
1 jan 2009 ano
63.369
-5.237
-7.63%
1 jan 2010 ano
49.149
-14.22
-22.44%
1 jan 2011 ano
46.364
-2.785
-5.67%
1 jan 2012 ano
54.985
+8.621
18.59%
1 jan 2013 ano
51.492
-3.492
-6.35%
1 jan 2014 ano
49.258
-2.234
-4.34%
1 jan 2015 ano
49.831
+0.573
1.16%
1 jan 2016 ano
48.478
-1.353
-2.72%
Classificação de países por estatísticas atuais por anos


Comentários: