29
/pt/
pt
AIzaSyAYiBZKx7MnpbEhh9jyipgxe19OcubqV5w
April 1, 2024
283097
Vietnam
VNM
true
2
1
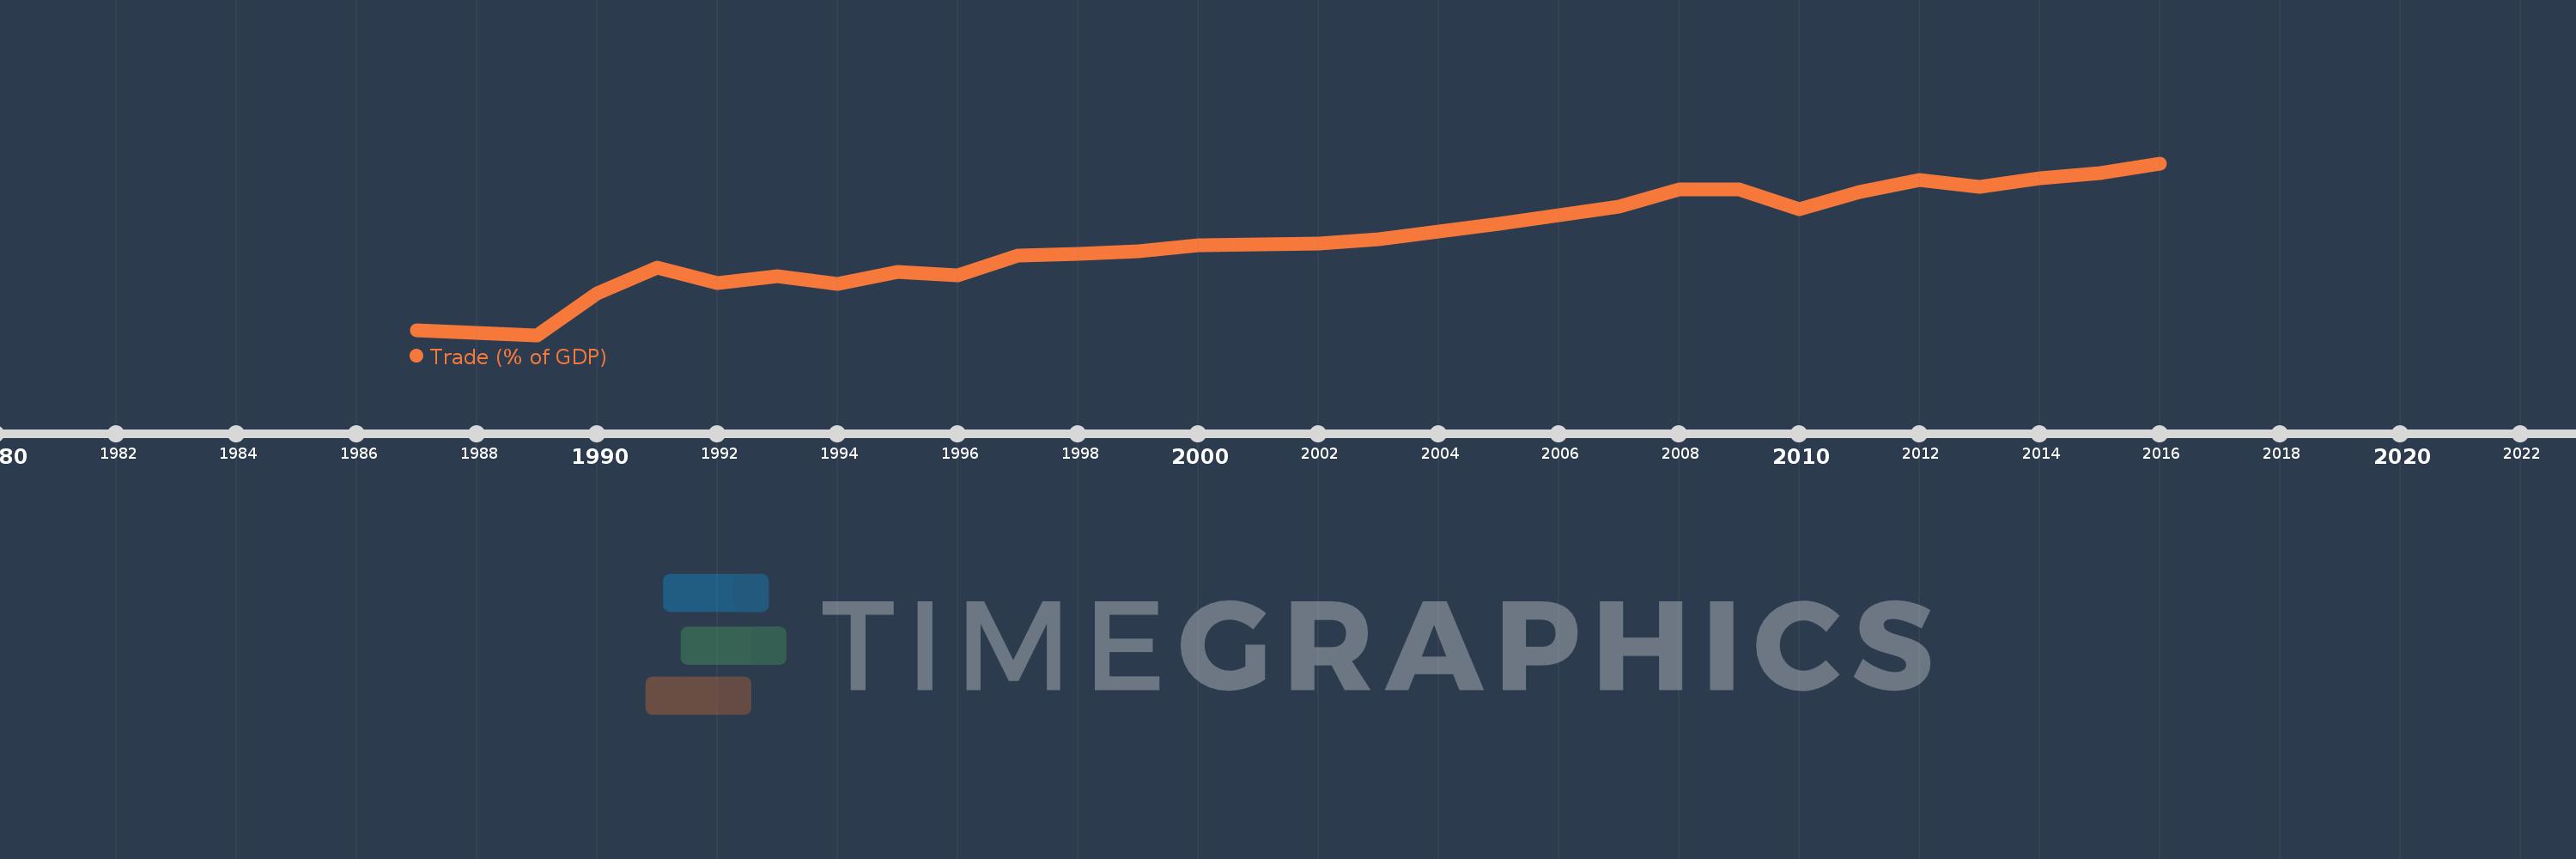
Trade (% of GDP)
2016,2015,2014,2013,2012,2011,2010,2009,2008,2007,2006,2005,2004,2003,2002,2001,2000,1999,1998,1997,1996,1995,1994,1993,1992,1991,1990,1989,1988,1987
Estas estatísticas em outros países:
AfghanistanAlbaniaAlgeriaAngolaAntigua and BarbudaArab WorldArgentinaArmeniaArubaAustraliaAustriaAzerbaijanBahamas, TheBahrainBangladeshBarbadosBelarusBelgiumBelizeBeninBermudaBhutanBoliviaBosnia and HerzegovinaBotswanaBrazilBrunei DarussalamBulgariaBurkina FasoBurundiCabo VerdeCambodiaCameroonCanadaCaribbean small statesCentral African RepublicCentral Europe and the BalticsChadChileChinaColombiaComorosCongo, Dem. Rep.Congo, Rep.Costa RicaCote d'IvoireCroatiaCubaCyprusCzech RepublicDenmarkDjiboutiDominicaDominican RepublicEarly-demographic dividendEast Asia & PacificEast Asia & Pacific (excluding high income)East Asia & Pacific (IDA & IBRD countries)EcuadorEgypt, Arab Rep.El SalvadorEquatorial GuineaEritreaEstoniaEthiopiaEuro areaEurope & Central AsiaEurope & Central Asia (excluding high income)Europe & Central Asia (IDA & IBRD countries)European UnionFaroe IslandsFijiFinlandFragile and conflict affected situationsFranceFrench PolynesiaGabonGambia, TheGeorgiaGermanyGhanaGreeceGrenadaGuatemalaGuineaGuinea-BissauGuyanaHaitiHeavily indebted poor countries (HIPC)High incomeHondurasHong Kong SAR, ChinaHungaryIBRD onlyIcelandIDA & IBRD totalIDA blendIDA onlyIDA totalIndiaIndonesiaIran, Islamic Rep.IraqIrelandIsraelItalyJamaicaJapanJordanKazakhstanKenyaKiribatiKorea, Rep.KosovoKuwaitKyrgyz RepublicLao PDRLate-demographic dividendLatin America & Caribbean Latin America & Caribbean (excluding high income)Latin America & the Caribbean (IDA & IBRD countries)LatviaLeast developed countries: UN classificationLebanonLesothoLiberiaLibyaLithuaniaLow & middle incomeLow incomeLower middle incomeLuxembourgMacao SAR, ChinaMacedonia, FYRMadagascarMalawiMalaysiaMaldivesMaliMaltaMauritaniaMauritiusMexicoMicronesia, Fed. Sts.Middle East & North AfricaMiddle East & North Africa (excluding high income)Middle East & North Africa (IDA & IBRD countries)Middle incomeMoldovaMongoliaMontenegroMoroccoMozambiqueMyanmarNamibiaNepalNetherlandsNew CaledoniaNew ZealandNicaraguaNigerNigeriaNorth AmericaNorwayOECD membersOmanOther small statesPacific island small statesPakistanPalauPanamaPapua New GuineaParaguayPeruPhilippinesPolandPortugalPost-demographic dividendPre-demographic dividendPuerto RicoQatarRomaniaRussian FederationRwandaSamoaSaudi ArabiaSenegalSerbiaSeychellesSierra LeoneSingaporeSlovak RepublicSloveniaSmall statesSolomon IslandsSomaliaSouth AfricaSouth AsiaSouth Asia (IDA & IBRD)South SudanSpainSri LankaSt. Kitts and NevisSt. LuciaSt. Vincent and the GrenadinesSub-Saharan Africa Sub-Saharan Africa (excluding high income)Sub-Saharan Africa (IDA & IBRD countries)SudanSurinameSwazilandSwedenSwitzerlandSyrian Arab RepublicTajikistanTanzaniaThailandTimor-LesteTogoTongaTrinidad and TobagoTunisiaTurkeyTurkmenistanUgandaUkraineUnited Arab EmiratesUnited KingdomUnited StatesUpper middle incomeUruguayUzbekistanVanuatuVenezuela, RBVietnamWest Bank and GazaWorldYemen, Rep.ZambiaZimbabwe Linha do tempo:
Nesta escala de tempo está apresentado um gráfico de 1987 ano até 2016 ano Vietnam. Dados de 1986 ano ausente. O número de observações reais por data: 30.
Fonte (nome):
Indicadores de desenvolvimento mundial
Fonte (organização):
World Bank national accounts data, and OECD National Accounts data files.
Categorias:
Economy & Growth, Trade
Foi atualizado:
23 abr 2017 ano
Indicadores de alterações dos valores ao longo dos anos
Mínimo:
18.95
1 jan 1989 ano
Máximo:
178.767
1 jan 2016 ano
Na data de observação
Valor
Mudança absoluta
A alteração em relação ao valor anterior
1 jan 1987 ano
23.219
+23.219
0.0%
1 jan 1988 ano
20.799
-2.42
-10.42%
1 jan 1989 ano
18.95
-1.848
-8.89%
1 jan 1990 ano
57.904
+38.954
205.56%
1 jan 1991 ano
81.316
+23.411
40.43%
1 jan 1992 ano
66.947
-14.369
-17.67%
1 jan 1993 ano
73.577
+6.63
9.9%
1 jan 1994 ano
66.212
-7.365
-10.01%
1 jan 1995 ano
77.473
+11.261
17.01%
1 jan 1996 ano
74.721
-2.752
-3.55%
1 jan 1997 ano
92.706
+17.984
24.07%
1 jan 1998 ano
94.344
+1.639
1.77%
1 jan 1999 ano
97.001
+2.657
2.82%
1 jan 2000 ano
102.787
+5.786
5.97%
1 jan 2001 ano
103.244
+0.457
0.44%
1 jan 2002 ano
103.688
+0.444
0.43%
1 jan 2003 ano
107.829
+4.14
3.99%
1 jan 2004 ano
115.118
+7.289
6.76%
1 jan 2005 ano
122.261
+7.144
6.21%
1 jan 2006 ano
130.715
+8.454
6.91%
1 jan 2007 ano
138.314
+7.599
5.81%
1 jan 2008 ano
154.605
+16.292
11.78%
1 jan 2009 ano
154.317
-0.288
-0.19%
1 jan 2010 ano
136.311
-18.007
-11.67%
1 jan 2011 ano
152.217
+15.907
11.67%
1 jan 2012 ano
162.914
+10.697
7.03%
1 jan 2013 ano
156.554
-6.361
-3.9%
1 jan 2014 ano
165.094
+8.54
5.46%
1 jan 2015 ano
169.535
+4.44
2.69%
1 jan 2016 ano
178.767
+9.233
5.45%
Classificação de países por estatísticas atuais por anos


Comentários: