29
/pt/
pt
AIzaSyAYiBZKx7MnpbEhh9jyipgxe19OcubqV5w
April 1, 2024
163378
Jamaica
JAM
true
2
1
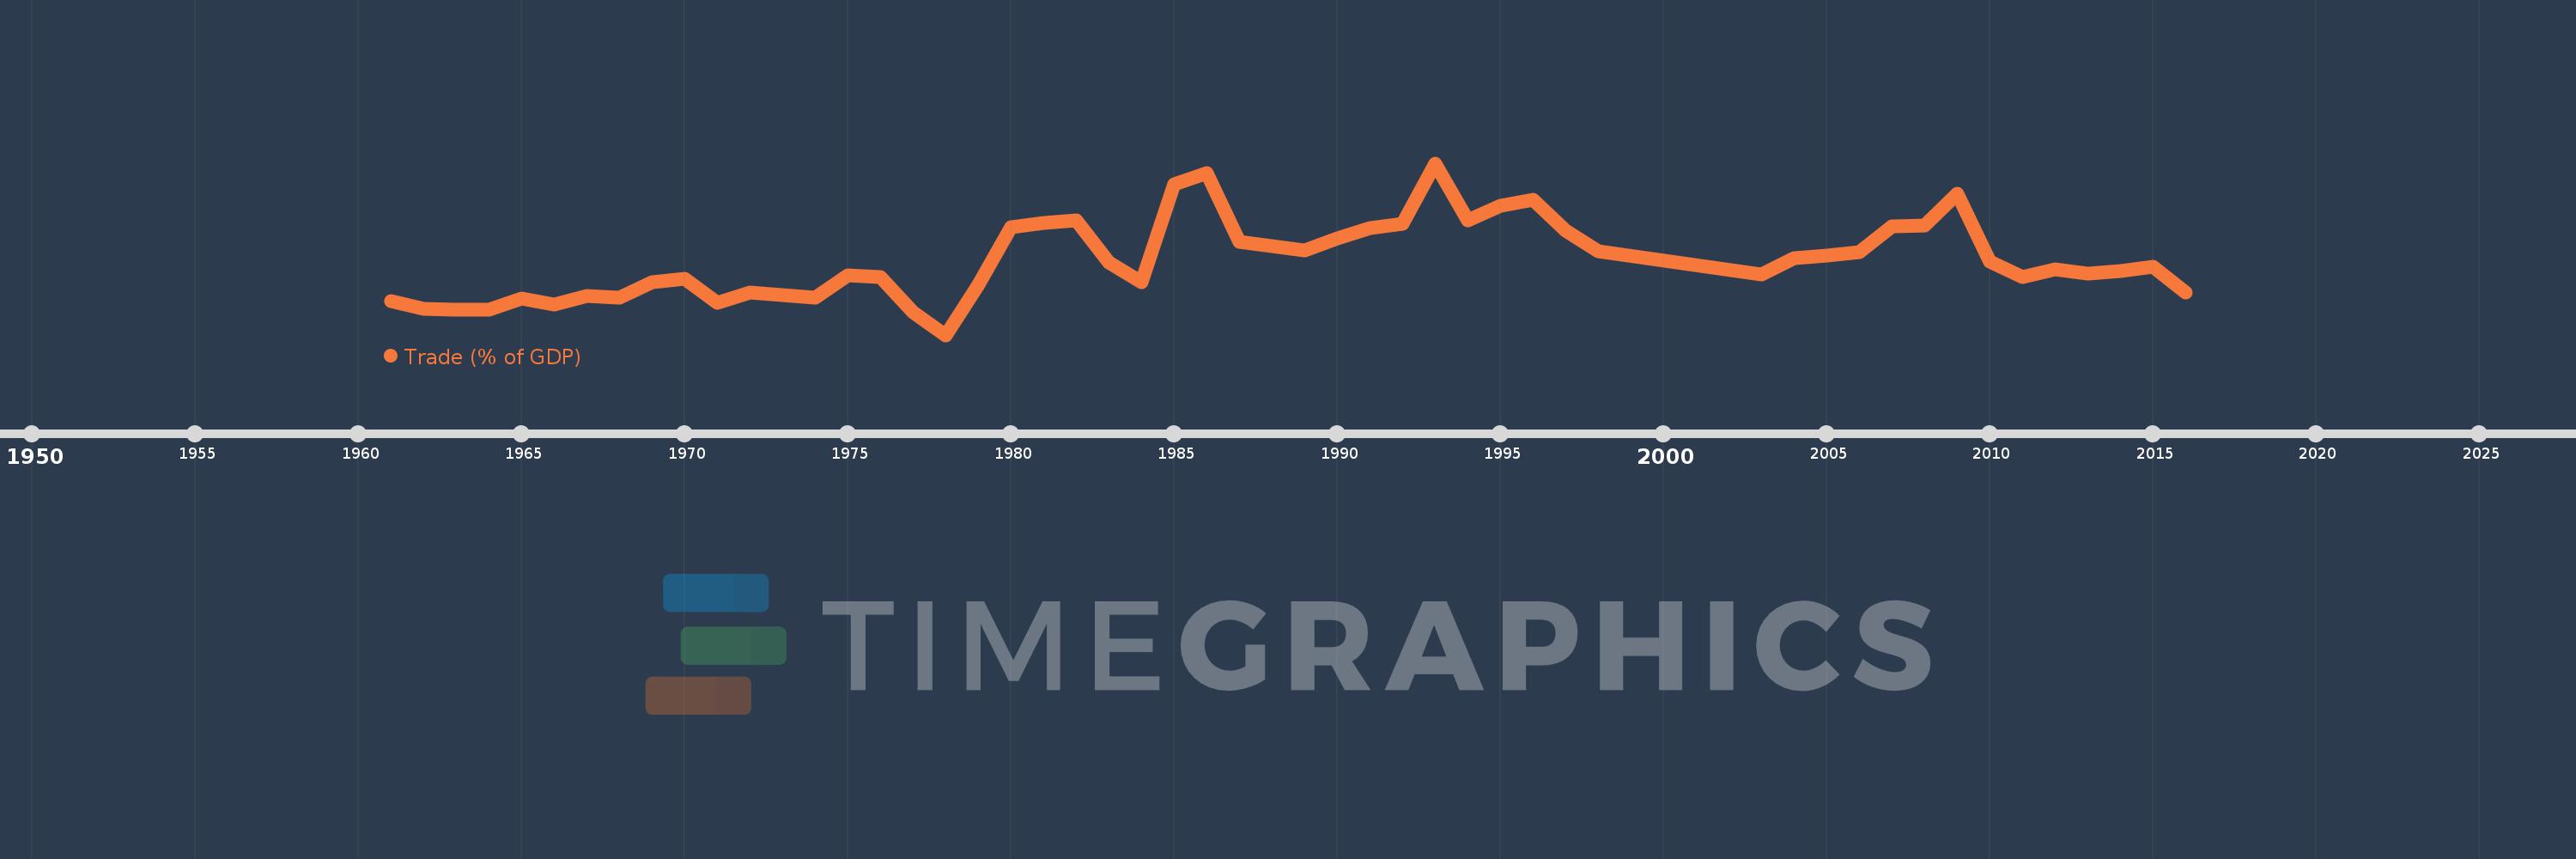
Trade (% of GDP)
2016,2015,2014,2013,2012,2011,2010,2009,2008,2007,2006,2005,2004,2003,1998,1997,1996,1995,1994,1993,1992,1991,1990,1989,1988,1987,1986,1985,1984,1983,1982,1981,1980,1979,1978,1977,1976,1975,1974,1973,1972,1971,1970,1969,1968,1967,1966,1965,1964,1963,1962,1961
Estas estatísticas em outros países:
AfghanistanAlbaniaAlgeriaAngolaAntigua and BarbudaArab WorldArgentinaArmeniaArubaAustraliaAustriaAzerbaijanBahamas, TheBahrainBangladeshBarbadosBelarusBelgiumBelizeBeninBermudaBhutanBoliviaBosnia and HerzegovinaBotswanaBrazilBrunei DarussalamBulgariaBurkina FasoBurundiCabo VerdeCambodiaCameroonCanadaCaribbean small statesCentral African RepublicCentral Europe and the BalticsChadChileChinaColombiaComorosCongo, Dem. Rep.Congo, Rep.Costa RicaCote d'IvoireCroatiaCubaCyprusCzech RepublicDenmarkDjiboutiDominicaDominican RepublicEarly-demographic dividendEast Asia & PacificEast Asia & Pacific (excluding high income)East Asia & Pacific (IDA & IBRD countries)EcuadorEgypt, Arab Rep.El SalvadorEquatorial GuineaEritreaEstoniaEthiopiaEuro areaEurope & Central AsiaEurope & Central Asia (excluding high income)Europe & Central Asia (IDA & IBRD countries)European UnionFaroe IslandsFijiFinlandFragile and conflict affected situationsFranceFrench PolynesiaGabonGambia, TheGeorgiaGermanyGhanaGreeceGrenadaGuatemalaGuineaGuinea-BissauGuyanaHaitiHeavily indebted poor countries (HIPC)High incomeHondurasHong Kong SAR, ChinaHungaryIBRD onlyIcelandIDA & IBRD totalIDA blendIDA onlyIDA totalIndiaIndonesiaIran, Islamic Rep.IraqIrelandIsraelItalyJamaicaJapanJordanKazakhstanKenyaKiribatiKorea, Rep.KosovoKuwaitKyrgyz RepublicLao PDRLate-demographic dividendLatin America & Caribbean Latin America & Caribbean (excluding high income)Latin America & the Caribbean (IDA & IBRD countries)LatviaLeast developed countries: UN classificationLebanonLesothoLiberiaLibyaLithuaniaLow & middle incomeLow incomeLower middle incomeLuxembourgMacao SAR, ChinaMacedonia, FYRMadagascarMalawiMalaysiaMaldivesMaliMaltaMauritaniaMauritiusMexicoMicronesia, Fed. Sts.Middle East & North AfricaMiddle East & North Africa (excluding high income)Middle East & North Africa (IDA & IBRD countries)Middle incomeMoldovaMongoliaMontenegroMoroccoMozambiqueMyanmarNamibiaNepalNetherlandsNew CaledoniaNew ZealandNicaraguaNigerNigeriaNorth AmericaNorwayOECD membersOmanOther small statesPacific island small statesPakistanPalauPanamaPapua New GuineaParaguayPeruPhilippinesPolandPortugalPost-demographic dividendPre-demographic dividendPuerto RicoQatarRomaniaRussian FederationRwandaSamoaSaudi ArabiaSenegalSerbiaSeychellesSierra LeoneSingaporeSlovak RepublicSloveniaSmall statesSolomon IslandsSomaliaSouth AfricaSouth AsiaSouth Asia (IDA & IBRD)South SudanSpainSri LankaSt. Kitts and NevisSt. LuciaSt. Vincent and the GrenadinesSub-Saharan Africa Sub-Saharan Africa (excluding high income)Sub-Saharan Africa (IDA & IBRD countries)SudanSurinameSwazilandSwedenSwitzerlandSyrian Arab RepublicTajikistanTanzaniaThailandTimor-LesteTogoTongaTrinidad and TobagoTunisiaTurkeyTurkmenistanUgandaUkraineUnited Arab EmiratesUnited KingdomUnited StatesUpper middle incomeUruguayUzbekistanVanuatuVenezuela, RBVietnamWest Bank and GazaWorldYemen, Rep.ZambiaZimbabwe Linha do tempo:
Nesta escala de tempo está apresentado um gráfico de 1961 ano até 2016 ano Jamaica. Dados de 1960 ano ausente. O número de observações reais por data: 52.
Fonte (nome):
Indicadores de desenvolvimento mundial
Fonte (organização):
World Bank national accounts data, and OECD National Accounts data files.
Categorias:
Economy & Growth, Trade
Foi atualizado:
23 abr 2017 ano
Indicadores de alterações dos valores ao longo dos anos
Mínimo:
58.149
1 jan 1978 ano
Máximo:
125.494
1 jan 1993 ano
Na data de observação
Valor
Mudança absoluta
A alteração em relação ao valor anterior
1 jan 1961 ano
71.293
+71.293
0.0%
1 jan 1962 ano
68.295
-2.998
-4.21%
1 jan 1963 ano
67.939
-0.356
-0.52%
1 jan 1964 ano
68.205
+0.266
0.39%
1 jan 1965 ano
72.435
+4.23
6.2%
1 jan 1966 ano
70.147
-2.288
-3.16%
1 jan 1967 ano
73.321
+3.175
4.53%
1 jan 1968 ano
72.853
-0.468
-0.64%
1 jan 1969 ano
78.908
+6.055
8.31%
1 jan 1970 ano
80.216
+1.307
1.66%
1 jan 1971 ano
70.648
-9.568
-11.93%
1 jan 1972 ano
74.758
+4.111
5.82%
1 jan 1973 ano
73.845
-0.914
-1.22%
1 jan 1974 ano
72.679
-1.166
-1.58%
1 jan 1975 ano
81.581
+8.902
12.25%
1 jan 1976 ano
80.876
-0.705
-0.86%
1 jan 1977 ano
66.937
-13.939
-17.23%
1 jan 1978 ano
58.149
-8.788
-13.13%
1 jan 1979 ano
77.883
+19.734
33.94%
1 jan 1980 ano
100.439
+22.556
28.96%
1 jan 1981 ano
102.108
+1.668
1.66%
1 jan 1982 ano
102.996
+0.888
0.87%
1 jan 1983 ano
86.683
-16.313
-15.84%
1 jan 1984 ano
78.724
-7.96
-9.18%
1 jan 1985 ano
117.189
+38.465
48.86%
1 jan 1986 ano
121.555
+4.366
3.73%
1 jan 1987 ano
94.73
-26.826
-22.07%
1 jan 1988 ano
92.869
-1.86
-1.96%
1 jan 1989 ano
91.417
-1.452
-1.56%
1 jan 1990 ano
96.01
+4.593
5.02%
1 jan 1991 ano
99.94
+3.93
4.09%
1 jan 1992 ano
101.599
+1.659
1.66%
1 jan 1993 ano
125.494
+23.896
23.52%
1 jan 1994 ano
103.022
-22.472
-17.91%
1 jan 1995 ano
108.777
+5.754
5.59%
1 jan 1996 ano
111.303
+2.526
2.32%
1 jan 1997 ano
99.068
-12.235
-10.99%
1 jan 1998 ano
90.992
-8.076
-8.15%
1 jan 2003 ano
81.847
-9.145
-10.05%
1 jan 2004 ano
88.151
+6.304
7.7%
1 jan 2005 ano
89.318
+1.168
1.32%
1 jan 2006 ano
90.488
+1.17
1.31%
1 jan 2007 ano
100.746
+10.258
11.34%
1 jan 2008 ano
101.244
+0.499
0.5%
1 jan 2009 ano
113.578
+12.333
12.18%
1 jan 2010 ano
86.884
-26.694
-23.5%
1 jan 2011 ano
80.923
-5.961
-6.86%
1 jan 2012 ano
83.847
+2.924
3.61%
1 jan 2013 ano
82.065
-1.782
-2.13%
1 jan 2014 ano
83.318
+1.253
1.53%
1 jan 2015 ano
84.751
+1.433
1.72%
1 jan 2016 ano
74.971
-9.78
-11.54%
Classificação de países por estatísticas atuais por anos


Comentários: